Unlock a world of possibilities! Login now and discover the exclusive benefits awaiting you.
- Qlik Community
- :
- All Forums
- :
- QlikView App Dev
- :
- Big challenge: monitoring campaigns performance
- Subscribe to RSS Feed
- Mark Topic as New
- Mark Topic as Read
- Float this Topic for Current User
- Bookmark
- Subscribe
- Mute
- Printer Friendly Page
- Mark as New
- Bookmark
- Subscribe
- Mute
- Subscribe to RSS Feed
- Permalink
- Report Inappropriate Content
Big challenge: monitoring campaigns performance
Hi all,
I have a challenge with a data model built to analyze campaigns performance.
My goals are:
- calculate how many orders/customers involved in campaign have done from start date to end date of campaign;
- calculate how many orders/customers in the group control (sample customers thate are not involved in campaign management) have done from start date to end date of campaign.
- The main KPI is the 'Campaign Response': Orders/Customers.
I have to obtain a table in which for each row (single campaign) are calculated: Response of customers involved, response of sample customers.
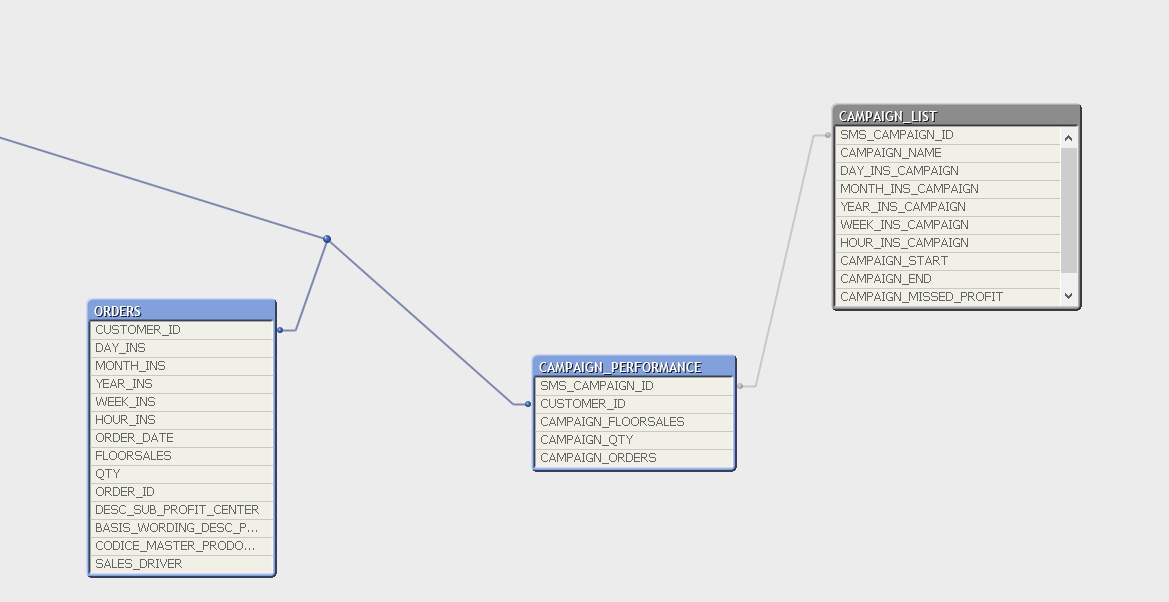
The first model was:

In order to calculate the response of sample customers I need to 'link' 'Campaign_Start' and 'Campaign_End' (CAMPAIGN LIST) to 'Order_date' (ORDERS) in wich Sample Customer have a boolean field 'Sample Y/N'.
My questions:
- What do you think about a link table using 'Interval Match' function?
- If I link Campaign List with Orders, is built a cicrcular reference?
Any suggestions or discussions are appreciated.
Thanks,
Romina
Accepted Solutions
- Mark as New
- Bookmark
- Subscribe
- Mute
- Subscribe to RSS Feed
- Permalink
- Report Inappropriate Content
Hi Romani,
This is a typical example of date ranges (search for 'date range' in the forums and you will get lots of posts and blogs on the subject).
A good example (amongst many other) is here : http://community.qlik.com/blogs/qlikviewdesignblog/2013/02/12/reference-dates
We use it a lot ourselves, also doing marketing campaign analysis at our company.
The 'general trick' is to generate a link between every possible date with your data.
If you link your campaign ID with every single date between start and and date of the campaign you will select all these dates when you select a campaign. At first most people fear that this will generate a lot more data but this is in most cases not a problem. Using this trick dates and date ranges become 'associated' with the data and this is how QV works at ist best.
How to generate this reference date ?
CampaignDatesRanges:
Load SME_CAMPAIGN_ID,
Date( CAMPAIGN_START+ IterNo() – 1 ) as ORDER_DATE
Resident CAMPAIGN_LIST
While IterNo() <= CAMPAIGN_END - CAMPAIGN_START + 1 ;
Then you can just make a chart with campaignid as the dimension, and the KPI's as expressions...
Mark