Unlock a world of possibilities! Login now and discover the exclusive benefits awaiting you.
- Qlik Community
- :
- All Forums
- :
- QlikView App Dev
- :
- Bucket Wise Bar Graphs to Show Top 'N'
- Subscribe to RSS Feed
- Mark Topic as New
- Mark Topic as Read
- Float this Topic for Current User
- Bookmark
- Subscribe
- Mute
- Printer Friendly Page
- Mark as New
- Bookmark
- Subscribe
- Mute
- Subscribe to RSS Feed
- Permalink
- Report Inappropriate Content
Bucket Wise Bar Graphs to Show Top 'N'
Hi All,
I have a data sheet (for example) like this below:
| Seller | Sales |
| Andy | 100 |
| Smith | 150 |
| John | 80 |
| Brent | 60 |
| Dan | 200 |
| Scott | 250 |
| Kenny | 180 |
| Dick | 70 |
| Paul | 90 |
| Bell | 120 |
| Chris | 150 |
| Mitchel | 130 |
| Cook | 50 |
| Corey | 210 |
| Bravo | 140 |
| George | 240 |
| Mark | 110 |
| Steve | 190 |
| Chet | 160 |
| Peter | 220 |
| Tom | 170 |
REQUIREMENT:
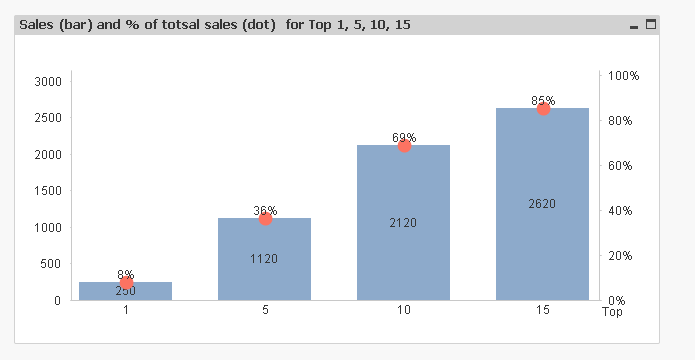
Now in a Bar Graph, I need to show Bucket Wise Data for the Top Seller(Top 1), Top 5, Top 10 and Top 15 Sellers in 4 Bars, and with their Count and % of contribution to the Total Sales (i.e 3070).
Could someone show me with an example with this data? It would be really appreciated.
Regards!
- Tags:
- bucket
Accepted Solutions
- Mark as New
- Bookmark
- Subscribe
- Mute
- Subscribe to RSS Feed
- Permalink
- Report Inappropriate Content
- Mark as New
- Bookmark
- Subscribe
- Mute
- Subscribe to RSS Feed
- Permalink
- Report Inappropriate Content
Check the solution of dynamic top/bottom in the file attached
- Mark as New
- Bookmark
- Subscribe
- Mute
- Subscribe to RSS Feed
- Permalink
- Report Inappropriate Content
like this?

- Mark as New
- Bookmark
- Subscribe
- Mute
- Subscribe to RSS Feed
- Permalink
- Report Inappropriate Content
Hye Massimo,
Greetings!
I guess the image you have displayed is my actual solution. many thanks.
Could you please help more on this by sharing the app?
Really appreciated.
- Mark as New
- Bookmark
- Subscribe
- Mute
- Subscribe to RSS Feed
- Permalink
- Report Inappropriate Content
Hi Kozins,
Thank you.
It helped me somehow, but I wanted my Top 5, Top 10 etc to be clubbed into a single single bar.
Regards!
- Mark as New
- Bookmark
- Subscribe
- Mute
- Subscribe to RSS Feed
- Permalink
- Report Inappropriate Content
PFA
- Mark as New
- Bookmark
- Subscribe
- Mute
- Subscribe to RSS Feed
- Permalink
- Report Inappropriate Content
Many a Thanks Massimo.
It was really helpful. One more request I have, if you can help.
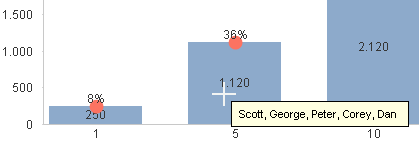
Can it be possible somehow to display the names of the Sellers (somehow) on each Bars.
Something if we hover the mouse or by any means?
- Mark as New
- Bookmark
- Subscribe
- Mute
- Subscribe to RSS Feed
- Permalink
- Report Inappropriate Content
just an idea

- Mark as New
- Bookmark
- Subscribe
- Mute
- Subscribe to RSS Feed
- Permalink
- Report Inappropriate Content
Thanks a lot again Massimo for quick help. It was really appreciated.
I will check on your suggestions.
God Bless!!!