Unlock a world of possibilities! Login now and discover the exclusive benefits awaiting you.
- Qlik Community
- :
- All Forums
- :
- QlikView App Dev
- :
- Budget Vs Actuals Graph
- Subscribe to RSS Feed
- Mark Topic as New
- Mark Topic as Read
- Float this Topic for Current User
- Bookmark
- Subscribe
- Mute
- Printer Friendly Page
- Mark as New
- Bookmark
- Subscribe
- Mute
- Subscribe to RSS Feed
- Permalink
- Report Inappropriate Content
Budget Vs Actuals Graph
I am trying to graph my actual sales vs budgeted sales.
I have a table with the budget per customer per month.
I also have a table with my actual sales data with a date from which I created additional columns in that table including month.
I would like to show the YTD budget as a linear graph along with the actuals as line (or bars) in the same chart.
I am able to do this by two charts with one transparent above the other, but was wondering if there was a way to do it in one chart.
The problem is that I have no links between the expressions required in one graph to the other, so I can't use one dimension that covers both, at least not as my data model stands.
Any ideas?
- « Previous Replies
-
- 1
- 2
- Next Replies »
Accepted Solutions
- Mark as New
- Bookmark
- Subscribe
- Mute
- Subscribe to RSS Feed
- Permalink
- Report Inappropriate Content
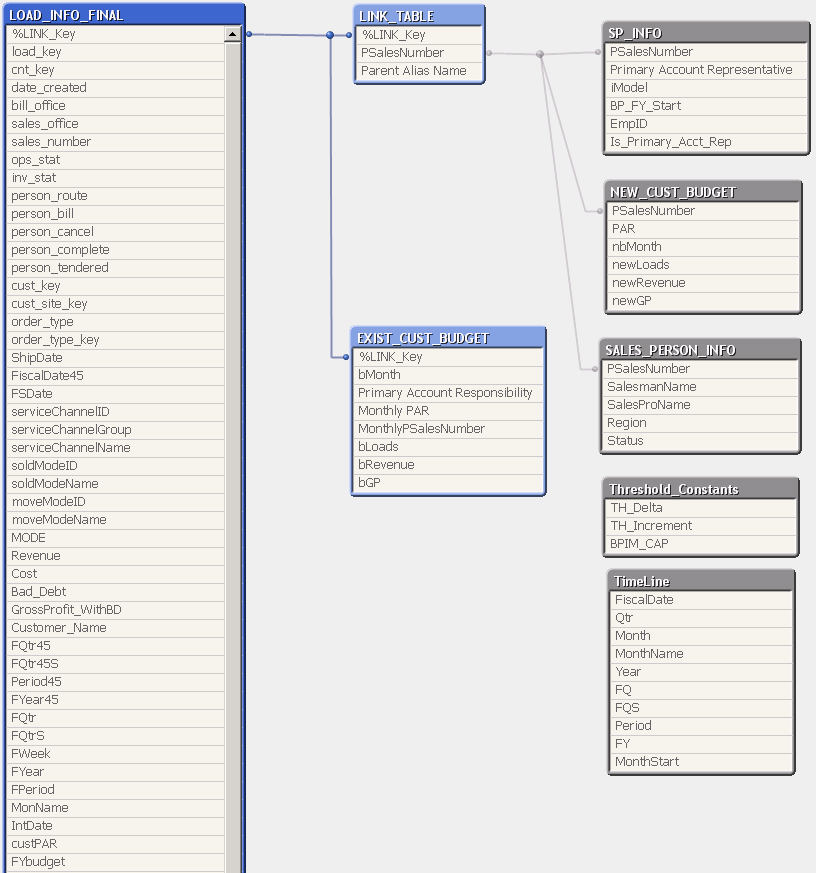
Can you try adding another field to that %LINK_Key? Then you should be able to put them on the same chart just using either FPeriod or bMonth as the dimension.
LOAD_INFO_FINAL:
...
[Parent Alias Name] & '|' & PSalesNumber & '|' & FPeriod as %LINK_KEY //or however you create your keys
...
EXIST_CUST_BUDGET:
...
[Parent Alias Name] & '|' & PSalesNumber & '|' & bMonth as %LINK_KEY
...
- Mark as New
- Bookmark
- Subscribe
- Mute
- Subscribe to RSS Feed
- Permalink
- Report Inappropriate Content
If the data is related (same dates, customers, etc.), I would say that the data should be linked or joined in the data model. Then making your chart would be a whole lot easier too.
- Mark as New
- Bookmark
- Subscribe
- Mute
- Subscribe to RSS Feed
- Permalink
- Report Inappropriate Content
Unfortunately they are not related as I have a date island in place
- Mark as New
- Bookmark
- Subscribe
- Mute
- Subscribe to RSS Feed
- Permalink
- Report Inappropriate Content
Can you post a screenshot of your table viewer (CTRL+T)? Or even better yet, a sample .qvw?
- Mark as New
- Bookmark
- Subscribe
- Mute
- Subscribe to RSS Feed
- Permalink
- Report Inappropriate Content
Chart Dimensions: bMonth (1-12 from budget table) and FPeriod (1-12 from load data)
Actuals Expression:
=count({<FYear={$(vSelectedYear)}, FYbudgetCode={2},
ShipDate={"<=$(=ceil(vCurrDateSelectedYear))"}
>} cnt_key)
Budget Expression:
=sum({<bMonth={"<=$(vCurrPeriod)"}>} bLoads)

Note that in the two charts at the right I am able to get the data to look right when I split the two tables, but when I merger the tow into one chart with two dimensions, the loads by FPeriod get repeated 12 times per month (and in some cases 13 with no budget data, i.e. 6 | - | 5 | 0)
- Mark as New
- Bookmark
- Subscribe
- Mute
- Subscribe to RSS Feed
- Permalink
- Report Inappropriate Content
Can you post a screenshot of your table viewer as well (CTRL+T)? I need to see how your data model looks.
- Mark as New
- Bookmark
- Subscribe
- Mute
- Subscribe to RSS Feed
- Permalink
- Report Inappropriate Content

- Mark as New
- Bookmark
- Subscribe
- Mute
- Subscribe to RSS Feed
- Permalink
- Report Inappropriate Content
What fields is %LINK_Key made up of?
- Mark as New
- Bookmark
- Subscribe
- Mute
- Subscribe to RSS Feed
- Permalink
- Report Inappropriate Content
Parent Alias Name and PSalesNumber
- Mark as New
- Bookmark
- Subscribe
- Mute
- Subscribe to RSS Feed
- Permalink
- Report Inappropriate Content
Can you try adding another field to that %LINK_Key? Then you should be able to put them on the same chart just using either FPeriod or bMonth as the dimension.
LOAD_INFO_FINAL:
...
[Parent Alias Name] & '|' & PSalesNumber & '|' & FPeriod as %LINK_KEY //or however you create your keys
...
EXIST_CUST_BUDGET:
...
[Parent Alias Name] & '|' & PSalesNumber & '|' & bMonth as %LINK_KEY
...
- « Previous Replies
-
- 1
- 2
- Next Replies »