Unlock a world of possibilities! Login now and discover the exclusive benefits awaiting you.
- Qlik Community
- :
- All Forums
- :
- QlikView App Dev
- :
- Re: Calculate/Expression from a specific table loa...
- Subscribe to RSS Feed
- Mark Topic as New
- Mark Topic as Read
- Float this Topic for Current User
- Bookmark
- Subscribe
- Mute
- Printer Friendly Page
- Mark as New
- Bookmark
- Subscribe
- Mute
- Subscribe to RSS Feed
- Permalink
- Report Inappropriate Content
Calculate/Expression from a specific table loaded into Qlikview
Hello,
I have two tables, and I am using Email as the key field to connect the two. I'd like to make a bar chart to count Emails from Table2 only. But since these two tables are connected by "Email", I was not able to do it successfully.
Some description for Table2 Email field, The same email may occur 0, 1 or more than 1 times denoting frequency (whereas Email in table1 will only show up 1time), so somebody's email may show up 6 times meaning this person has showed up 6times.
There's another thing that I'd like to accomplish, from table2, I'd like to do a count of those whose email has show up for more than 10 times, between 5 to 10 times, 2 to 4 times and 1 time. Is this possible?
My apology that I may not have described my data table well, please ask me questions if you find my description/question unclear. Thank you so much for your help.
Sameul
- « Previous Replies
-
- 1
- 2
- Next Replies »
Accepted Solutions
- Mark as New
- Bookmark
- Subscribe
- Mute
- Subscribe to RSS Feed
- Permalink
- Report Inappropriate Content
Samuel,
It possible to count Emails that don't have EmailTest associated with them. Try to change chart's calculated dimension to this
=dual(
if(aggr(count([EmailTest]),Email)>10, '>10 Appt',
if(aggr(count([EmailTest]),Email)>=5, '5 to 10 Appt',
if(aggr(count([EmailTest]),Email)>=2, '2 to 4 Appt',
if(aggr(count([EmailTest]),Email)=1, '1 Appt',
if(aggr(count([EmailTest]),Email)=0, '0 Appt')))))
,
if(aggr(count([EmailTest]),Email)>10, 1,
if(aggr(count([EmailTest]),Email)>=5, 2,
if(aggr(count([EmailTest]),Email)>=2, 3,
if(aggr(count([EmailTest]),Email)=1, 4, 5))))
)
And, change the expression to this:
count(distinct Email)
I'm not sure you'll like it because 0's bar is way larger than others. Anyway, for the sake of trying...
I'm sure you'll be back to QlikView, it is addictive  . You'll be better with time. Go through the QV training materials, try exercises, maybe get a book. The best training - try to answer questions on QlikCommunity.
I do not recommend forwarding posts to me (or to anyone in particular) directly. There are hundreds of very good QV specialists here, many of them better than I, and they'll be happy to help. And I am not always available.
Good like with your finals.
Regards,
Michael
- Mark as New
- Bookmark
- Subscribe
- Mute
- Subscribe to RSS Feed
- Permalink
- Report Inappropriate Content
Samuel,
See attached. Maybe it is not exactly what you need, but should be helpful.
- Mark as New
- Bookmark
- Subscribe
- Mute
- Subscribe to RSS Feed
- Permalink
- Report Inappropriate Content
Hi Michael,
thank you for your response. I am currently using evaluation edition/version of Qlikview, and I have reached the max limit of opening qvw files. Do you mind post the lines your use for the expression and maybe some screenshots?
Thank you so much!!
- Mark as New
- Bookmark
- Subscribe
- Mute
- Subscribe to RSS Feed
- Permalink
- Report Inappropriate Content
I can describe.
Table1 - only one field Email. Contains all values.
Table2 - field Email, contains subset of the values from Table1. Field "test" which is a copy of Email. Field ID.
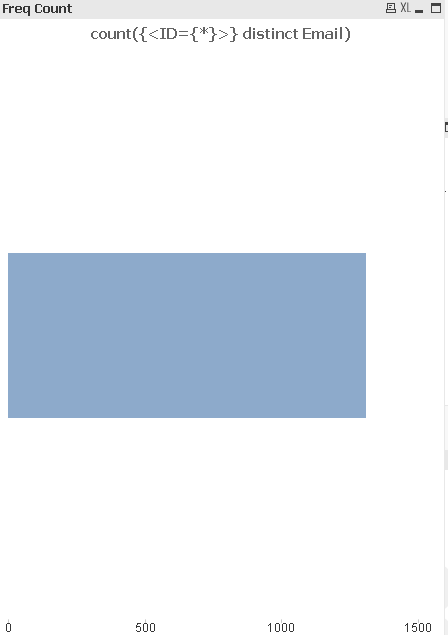
Chart where Emails from Table2 are counted has expression
count({<ID={*}>} distinct Email)
I didn't use any dimensions here, but you can if needed.
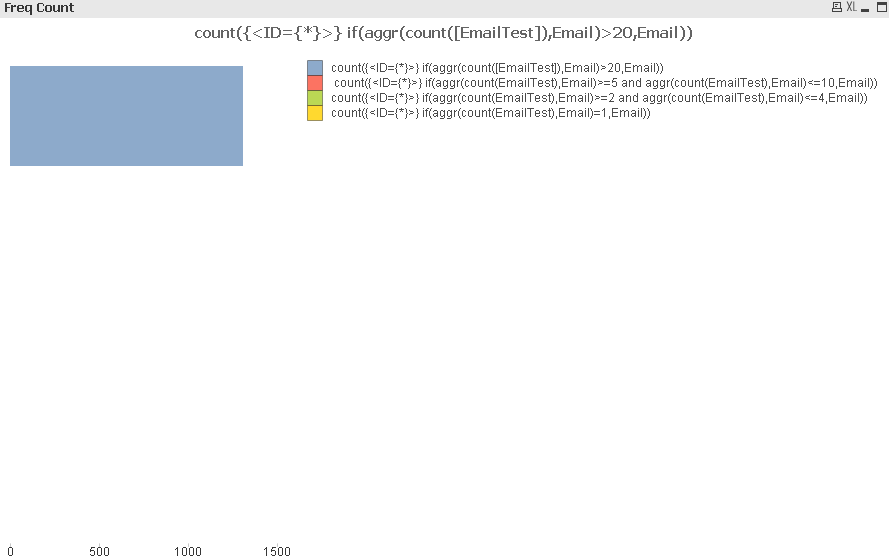
Chart where Emails are counted per frequency has four expressions
>10: count({<ID={*}>} if(aggr(count(test),Email)>10,Email))
5 to 10: count({<ID={*}>} if(aggr(count(test),Email)>=5 and aggr(count(test),Email)<=10,Email))
2 to 4: count({<ID={*}>} if(aggr(count(test),Email)>=2 and aggr(count(test),Email)<=4,Email))
1: count({<ID={*}>} if(aggr(count(test),Email)=1,Email))
No dimensions
Regards,
Michael
- Mark as New
- Bookmark
- Subscribe
- Mute
- Subscribe to RSS Feed
- Permalink
- Report Inappropriate Content
ok, i will give it a try and get back to you soon, many thanks~
- Mark as New
- Bookmark
- Subscribe
- Mute
- Subscribe to RSS Feed
- Permalink
- Report Inappropriate Content
Michael,
Thank you for taking the time. For the first expression, count({<ID={*}>} distinct Email), it generates a bar chart of one bar giving the number of email in both table (or maybe just one), but note that Table1 and Table2 both share the same name for field Email.
By the way, the email list contain in Table1 may not be a whole list (meaning that the email contain in table2 may not be found in Table2) **~**
For frequency, I think your code is getting pretty close, right now it's it's showing only one bar (the same bar from **~** (i think you should be able to understand it once seeing the picture2 I attached)
Also, I am hoping that these charts can be linked to the rest of the database, meaning that if I click on the frequency more than 10, then my tables, charts and other list boxes will be updated simultaneously (right now it doesn't seem like it's doing that)
Gratefully thank you for the help!
Samuel
- Mark as New
- Bookmark
- Subscribe
- Mute
- Subscribe to RSS Feed
- Permalink
- Report Inappropriate Content
Michael,
I thought to add a free more things, hopefully to make it more clear.
EmailTest is generated after I load table 2 with the code below (where TableZYX is Table2)
LOAD Email as EmailTest
FROM
[Current Testing File\XYZ.xlsx]
(ooxml, embedded labels, table is ZYX);
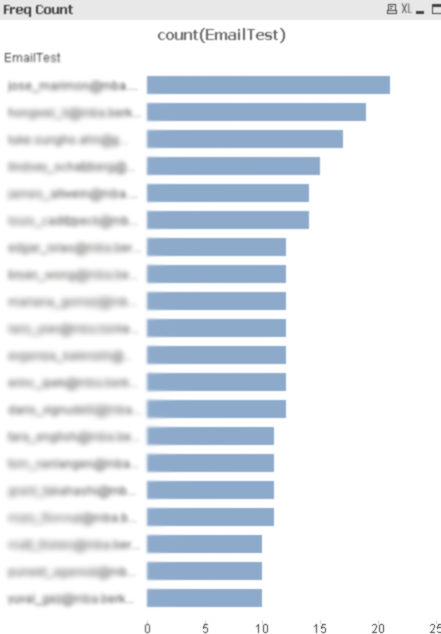
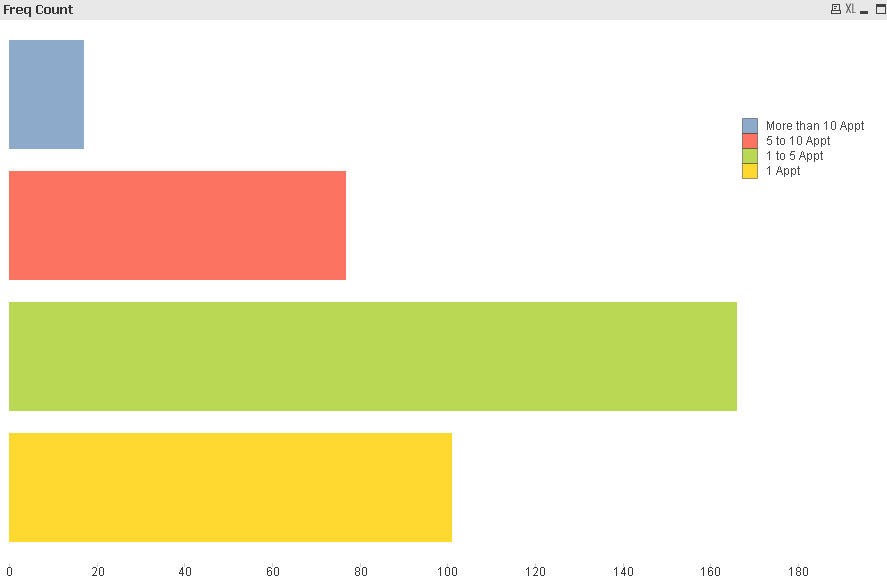
So far, I can easily create a chart like this:
simply with the expression: count(EmailTest) with EmailTest as the dimension., but the problem is that, EmailTest isn't linked to the rest of the Database
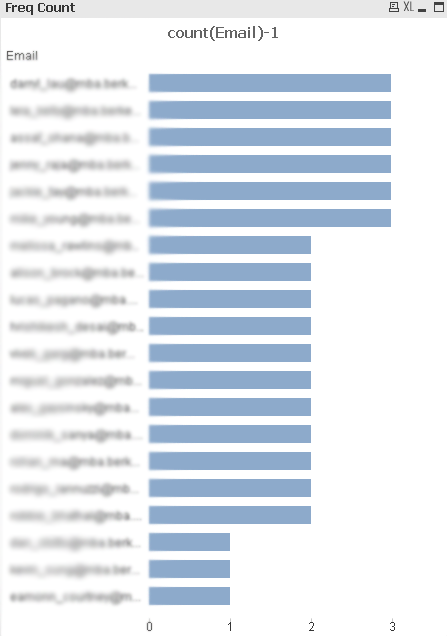
Also, when I tried to create a similar chart with count(Email)-1 with Email as the dimension, looks like it only look at the Email in Table1 but NOT both Table1 and Table2 (oh and by the way, the Email in Table1 is also not unique, so it can show up for more than once)
- Mark as New
- Bookmark
- Subscribe
- Mute
- Subscribe to RSS Feed
- Permalink
- Report Inappropriate Content
Michael,
Actually, I should have mentioned that, for table2 there's two fields that can be used as an unique field, Last Name and First Name. I think I can load to combine them to be "full name". This won't always be a unique field though since some people may have the same first and last names.
However, even after combining these two fields, I still don't have a solution of how to achieve what i mentioned previously.
Thanks,
Samuel
- Mark as New
- Bookmark
- Subscribe
- Mute
- Subscribe to RSS Feed
- Permalink
- Report Inappropriate Content
Samuel,
First, it doesn't matter if Table1 has all Email values or not. As soon as ID field in the expression count({<ID={*}>} distinct Email) belongs to the Table2, the result will be only fort the Table2.
Second, the frequency chart which shows only one bar. Either there are no results or you missed something. Actually, I see at least one the problem - you created EmailTest as logical island, not connected to anything. Try this:
LOAD
Email,
Email as EmailTest
FROM [Current Testing File\XYZ.xlsx] (ooxml, embedded labels, table is ZYX);
If you need further help, upload your application, I'll take a look.
Regards,
Michael
- Mark as New
- Bookmark
- Subscribe
- Mute
- Subscribe to RSS Feed
- Permalink
- Report Inappropriate Content
Michael,
It worked. Could you please tell me what's the difference? Why it makes a difference loading Email one more time? I have some limited programming background, it has been a hard time to understand Qlikview's programming language.
This is exactly what I wanted, EXCEPT that it's NOT clickable. You know how bar chart's bars are clickable, but this one is not for some reason, But when I click on other bar chart (or list boxes) this chart does get reloaded so it's attached with the rest of the data.
Do you need my qlikview file to solve this problem? If I pass you my qvw file, do I need to give you my excel data file as well?
Many Thanks
Samuel
- « Previous Replies
-
- 1
- 2
- Next Replies »