Unlock a world of possibilities! Login now and discover the exclusive benefits awaiting you.
- Qlik Community
- :
- All Forums
- :
- QlikView App Dev
- :
- Re: Calculate Monthly Average
- Subscribe to RSS Feed
- Mark Topic as New
- Mark Topic as Read
- Float this Topic for Current User
- Bookmark
- Subscribe
- Mute
- Printer Friendly Page
- Mark as New
- Bookmark
- Subscribe
- Mute
- Subscribe to RSS Feed
- Permalink
- Report Inappropriate Content
Calculate Monthly Average
Hi Everyone -
I have a table which lists a date and number of transactions for the last 3 months.
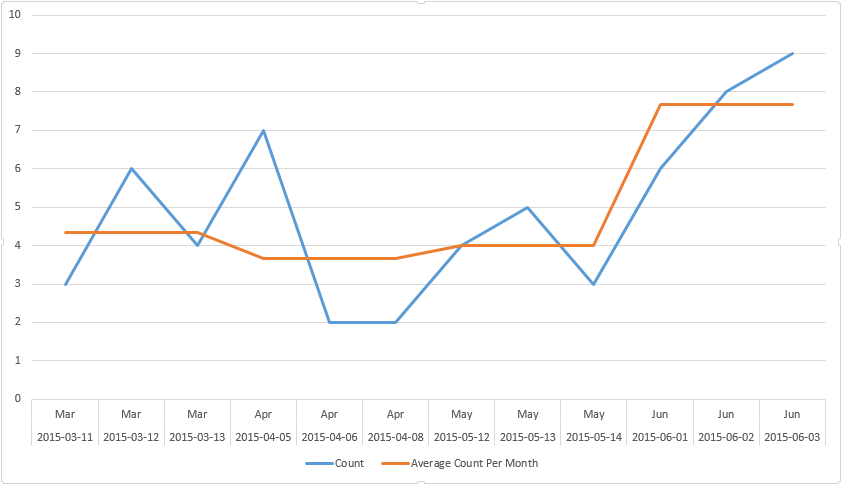
I am trying to add a third column called "Average Count Per Month" to show the average # of transactions per month. I would like to list the average number per month for each line so that I can create a graph similar to the one below (done through Excel).
I've tried using aggr() and sum()/count() a few different ways but no luck so far. Any idea how this can be done?
Thanks in advance.
Michael
| Date | Count | Average Count Per Month |
| 2015-03-11 | 3 | 4.33 |
| 2015-03-12 | 6 | 4.33 |
| 2015-03-13 | 4 | 4.33 |
| 2015-04-05 | 7 | 3.67 |
| 2015-04-06 | 2 | 3.67 |
| 2015-04-08 | 2 | 3.67 |
| 2015-05-12 | 4 | 4.00 |
| 2015-05-13 | 5 | 4.00 |
| 2015-05-14 | 3 | 4.00 |
| 2015-06-01 | 6 | 7.67 |
| 2015-06-02 | 8 | 7.67 |
| 2015-06-03 | 9 | 7.67 |
Accepted Solutions
- Mark as New
- Bookmark
- Subscribe
- Mute
- Subscribe to RSS Feed
- Permalink
- Report Inappropriate Content
Script Sample:
DataTable:
LOAD * INLINE [
Date, Count, Month
2015-03-11, 3, Mar
2015-03-12, 6, Mar
2015-03-13, 4, Mar
2015-04-05, 7, Apr
2015-04-06, 2, Apr
2015-04-08, 2, Apr
2015-05-12, 4, May
2015-05-13, 5, May
2015-05-14, 3, May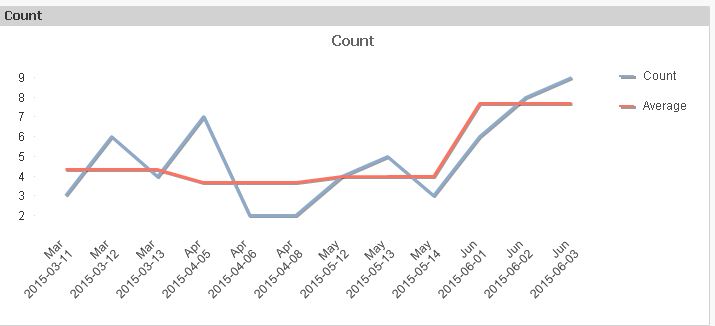
2015-06-01, 6, Jun
2015-06-02, 8, Jun
2015-06-03, 9, Jun
];
MonthAverage:
Load
Month,
round(Avg(Count),0.01) as Average
Resident DataTable
Group by Month;
- Mark as New
- Bookmark
- Subscribe
- Mute
- Subscribe to RSS Feed
- Permalink
- Report Inappropriate Content
try to make a pivot and group by Dates and use Average function at count.
then do a chart on pivot
Hope It will solve.
Thanks
A
- Mark as New
- Bookmark
- Subscribe
- Mute
- Subscribe to RSS Feed
- Permalink
- Report Inappropriate Content
You could add a month column, then add a table that contains the average for a given monthh that would be linked by month field. You could then graph that value in your line graph as well.
Table 1
| Date | Count | Month |
| 2015-03-11 | 3 | Mar |
| 2015-03-12 | 6 | Mar |
| 2015-03-13 | 4 | Mar |
| 2015-04-05 | 7 | Apr |
| 2015-04-06 | 2 | Apr |
| 2015-04-08 | 2 | Apr |
| 2015-05-12 | 4 | May |
| 2015-05-13 | 5 | May |
| 2015-05-14 | 3 | May |
| 2015-06-01 | 6 | Jun |
| 2015-06-02 | 8 | Jun |
| 2015-06-03 | 9 | Jun |
Table 2
| Month | Average Count Per Month |
| Mar | 4.33 |
| Apr | 3.67 |
| May | 4.00 |
| Jun | 7.67 |
- Mark as New
- Bookmark
- Subscribe
- Mute
- Subscribe to RSS Feed
- Permalink
- Report Inappropriate Content
Script Sample:
DataTable:
LOAD * INLINE [
Date, Count, Month
2015-03-11, 3, Mar
2015-03-12, 6, Mar
2015-03-13, 4, Mar
2015-04-05, 7, Apr
2015-04-06, 2, Apr
2015-04-08, 2, Apr
2015-05-12, 4, May
2015-05-13, 5, May
2015-05-14, 3, May
2015-06-01, 6, Jun
2015-06-02, 8, Jun
2015-06-03, 9, Jun
];
MonthAverage:
Load
Month,
round(Avg(Count),0.01) as Average
Resident DataTable
Group by Month;
- Mark as New
- Bookmark
- Subscribe
- Mute
- Subscribe to RSS Feed
- Permalink
- Report Inappropriate Content
HI Michael,
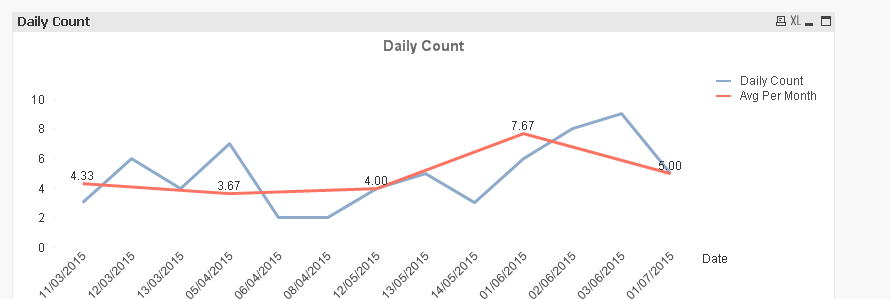
see the attached example, looks pretty close:
- Mark as New
- Bookmark
- Subscribe
- Mute
- Subscribe to RSS Feed
- Permalink
- Report Inappropriate Content
Thanks Tony. This did the trick.
Michael