Unlock a world of possibilities! Login now and discover the exclusive benefits awaiting you.
- Qlik Community
- :
- All Forums
- :
- QlikView App Dev
- :
- Re: Calculate field in Pivot of Nested IF statemen...
- Subscribe to RSS Feed
- Mark Topic as New
- Mark Topic as Read
- Float this Topic for Current User
- Bookmark
- Subscribe
- Mute
- Printer Friendly Page
- Mark as New
- Bookmark
- Subscribe
- Mute
- Subscribe to RSS Feed
- Permalink
- Report Inappropriate Content
Calculate field in Pivot of Nested IF statements
Pivot Table Calculated field question
To Calculate Service Aging I did the following in the
Load Script:
fabs(Interval([Date Policy Mailed]-[Effective Date], 'd')) as 'Service Age'
Here's how I need the data to appear in the pivot for Aging:
I need a count of Service Age by using the following nested IF statements:
=IF([Service Age] <15,'Under 15 Days',IF([Service Age] <31,'16-30 Days',IF([Service Age] <61,'31-60 Days',IF([Service Age] <91,'61-90 Days','Over 90 Days'))))
So my questions are:
1. Should I have made Service Aging a variable? As I need per row the service age calculated
2. How do I place the nested if statements as columns with a count in the pivot table?
I have included an example snapshot. THanks for your thoughts! Appreciate the help.
Accepted Solutions
- Mark as New
- Bookmark
- Subscribe
- Mute
- Subscribe to RSS Feed
- Permalink
- Report Inappropriate Content
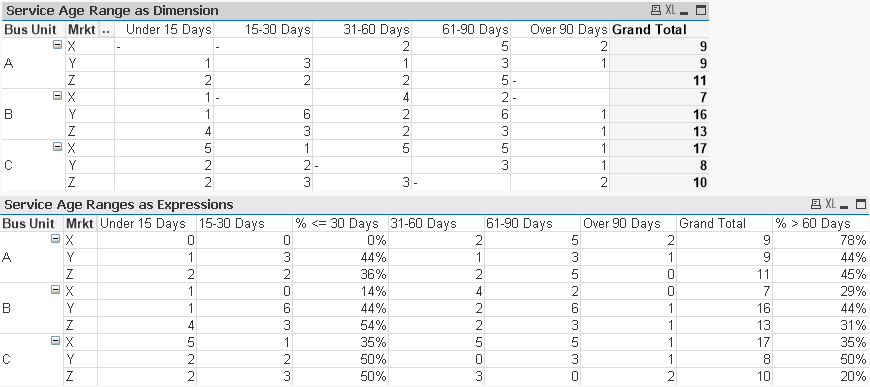
It's working like I think you want with sample data.
LOAD *
,if([Service Age] <15,dual('Under 15 Days',1)
,if([Service Age] <31,dual('15-30 Days' ,2)
,if([Service Age] <61,dual('31-60 Days' ,3)
,if([Service Age] <91,dual('61-90 Days' ,4)
, dual('Over 90 Days' ,5))))) as [Service Age Range]
;
LOAD
recno() as ID
,chr(ord('A')+floor(rand()*3)) as [Bus Unit]
,chr(ord('X')+floor(rand()*3)) as [Mrkt]
,ceil(rand()*100) as [Service Age]
AUTOGENERATE 100
;
- Mark as New
- Bookmark
- Subscribe
- Mute
- Subscribe to RSS Feed
- Permalink
- Report Inappropriate Content
Normally, I'd put those if() statements in your script and load a new field, [Service Age Range], which I'd make a chart dimension. But your chart is more complicated than that. I'd probably brute force it with set analysis and separate expressions for each column.
count({<[Service Age]*={"<=15"}>} distinct [Something])
count({<[Service Age]*={">15<=30"}>} distinct [Something])
count({<[Service Age]*={"=30"}>} distinct [Something])/count(distinct [Something])
And so on. Hopefully the pattern is clear.
- Mark as New
- Bookmark
- Subscribe
- Mute
- Subscribe to RSS Feed
- Permalink
- Report Inappropriate Content
Thank you John for responding, appreciate your help.
I will implement your suggestions and see how it pans out and update you.
Have a great day John! #ttyl
- Mark as New
- Bookmark
- Subscribe
- Mute
- Subscribe to RSS Feed
- Permalink
- Report Inappropriate Content
Thanks for the suggestion John!
The IF statements are not working for my load script (could be to user error)
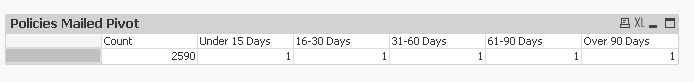
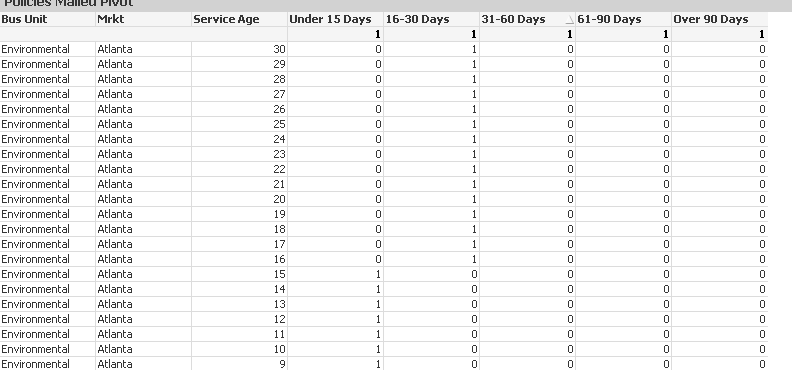
However, I placed the statements in a expression box for the pivot and it only gives a value of 1 across each iteration of count of days. I attached a picture to show results. I should have a rolling total across the Column headings "Under 15.....etc that should total 2590. However, each column is just showing 1 as a value, when there should be a count there.
- Mark as New
- Bookmark
- Subscribe
- Mute
- Subscribe to RSS Feed
- Permalink
- Report Inappropriate Content
See it works as I need it to with the statements you privided in a Straight Table.
However, I need this to display in a Pivot
- Mark as New
- Bookmark
- Subscribe
- Mute
- Subscribe to RSS Feed
- Permalink
- Report Inappropriate Content
It's working like I think you want with sample data.
LOAD *
,if([Service Age] <15,dual('Under 15 Days',1)
,if([Service Age] <31,dual('15-30 Days' ,2)
,if([Service Age] <61,dual('31-60 Days' ,3)
,if([Service Age] <91,dual('61-90 Days' ,4)
, dual('Over 90 Days' ,5))))) as [Service Age Range]
;
LOAD
recno() as ID
,chr(ord('A')+floor(rand()*3)) as [Bus Unit]
,chr(ord('X')+floor(rand()*3)) as [Mrkt]
,ceil(rand()*100) as [Service Age]
AUTOGENERATE 100
;
- Mark as New
- Bookmark
- Subscribe
- Mute
- Subscribe to RSS Feed
- Permalink
- Report Inappropriate Content
Yes, this is exactly what I need John!
I like the Service Age Range as expressions, it's perfect.
I;m not familiar with some of the syntax in the load script to call my actual business unit value.
I will try to figure it out and then run it ny you.
I really appreciate your time and efforts to help me. Thank You