Unlock a world of possibilities! Login now and discover the exclusive benefits awaiting you.
- Qlik Community
- :
- All Forums
- :
- QlikView App Dev
- :
- Calculating Customer Purchasing Cycle
- Subscribe to RSS Feed
- Mark Topic as New
- Mark Topic as Read
- Float this Topic for Current User
- Bookmark
- Subscribe
- Mute
- Printer Friendly Page
- Mark as New
- Bookmark
- Subscribe
- Mute
- Subscribe to RSS Feed
- Permalink
- Report Inappropriate Content
Calculating Customer Purchasing Cycle
Hi All
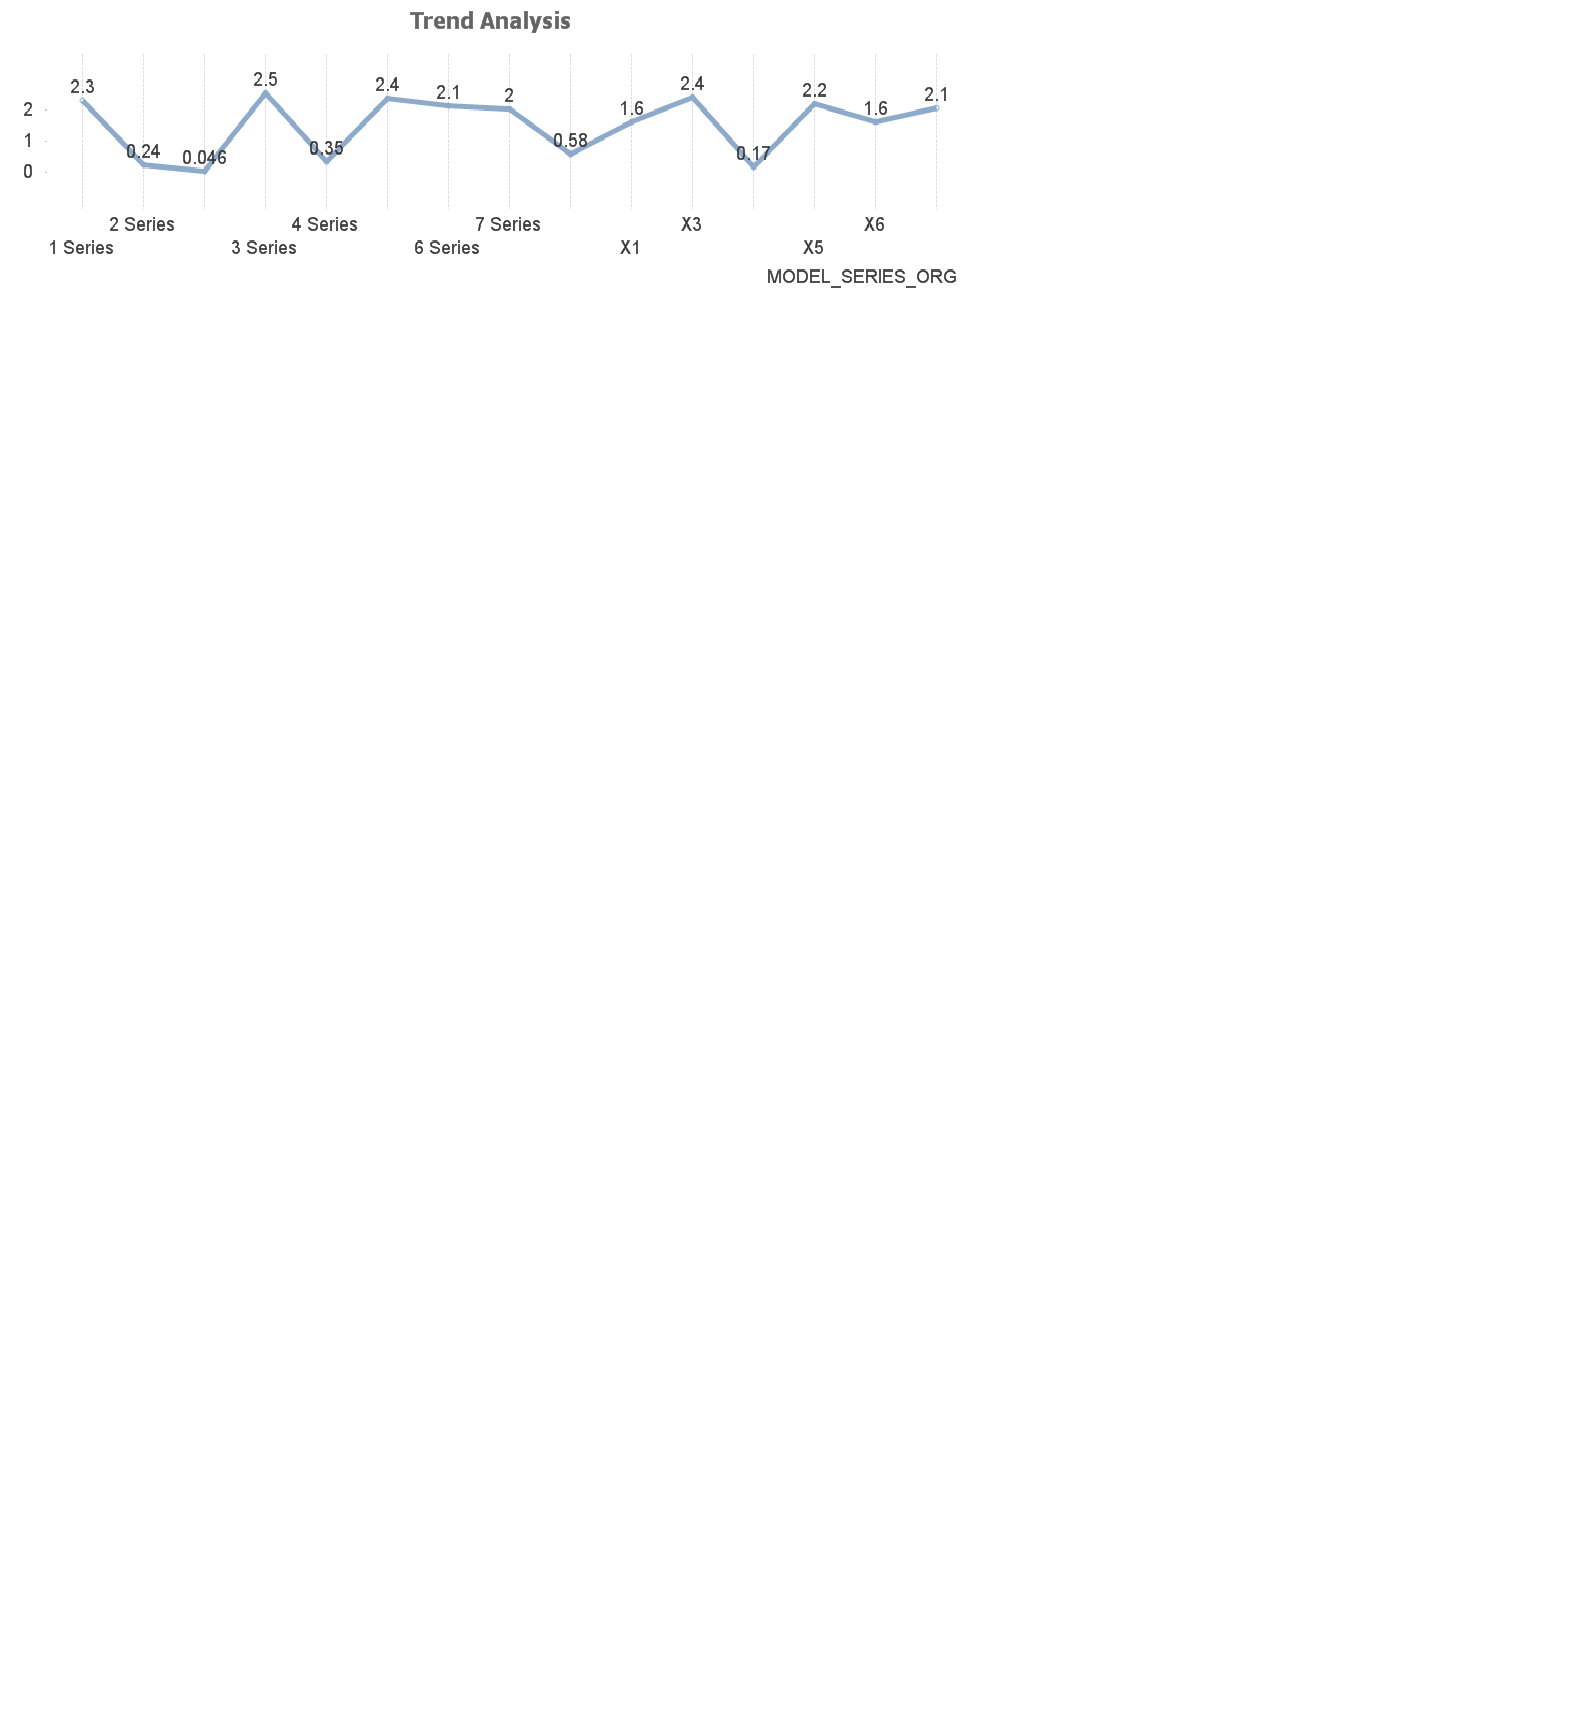
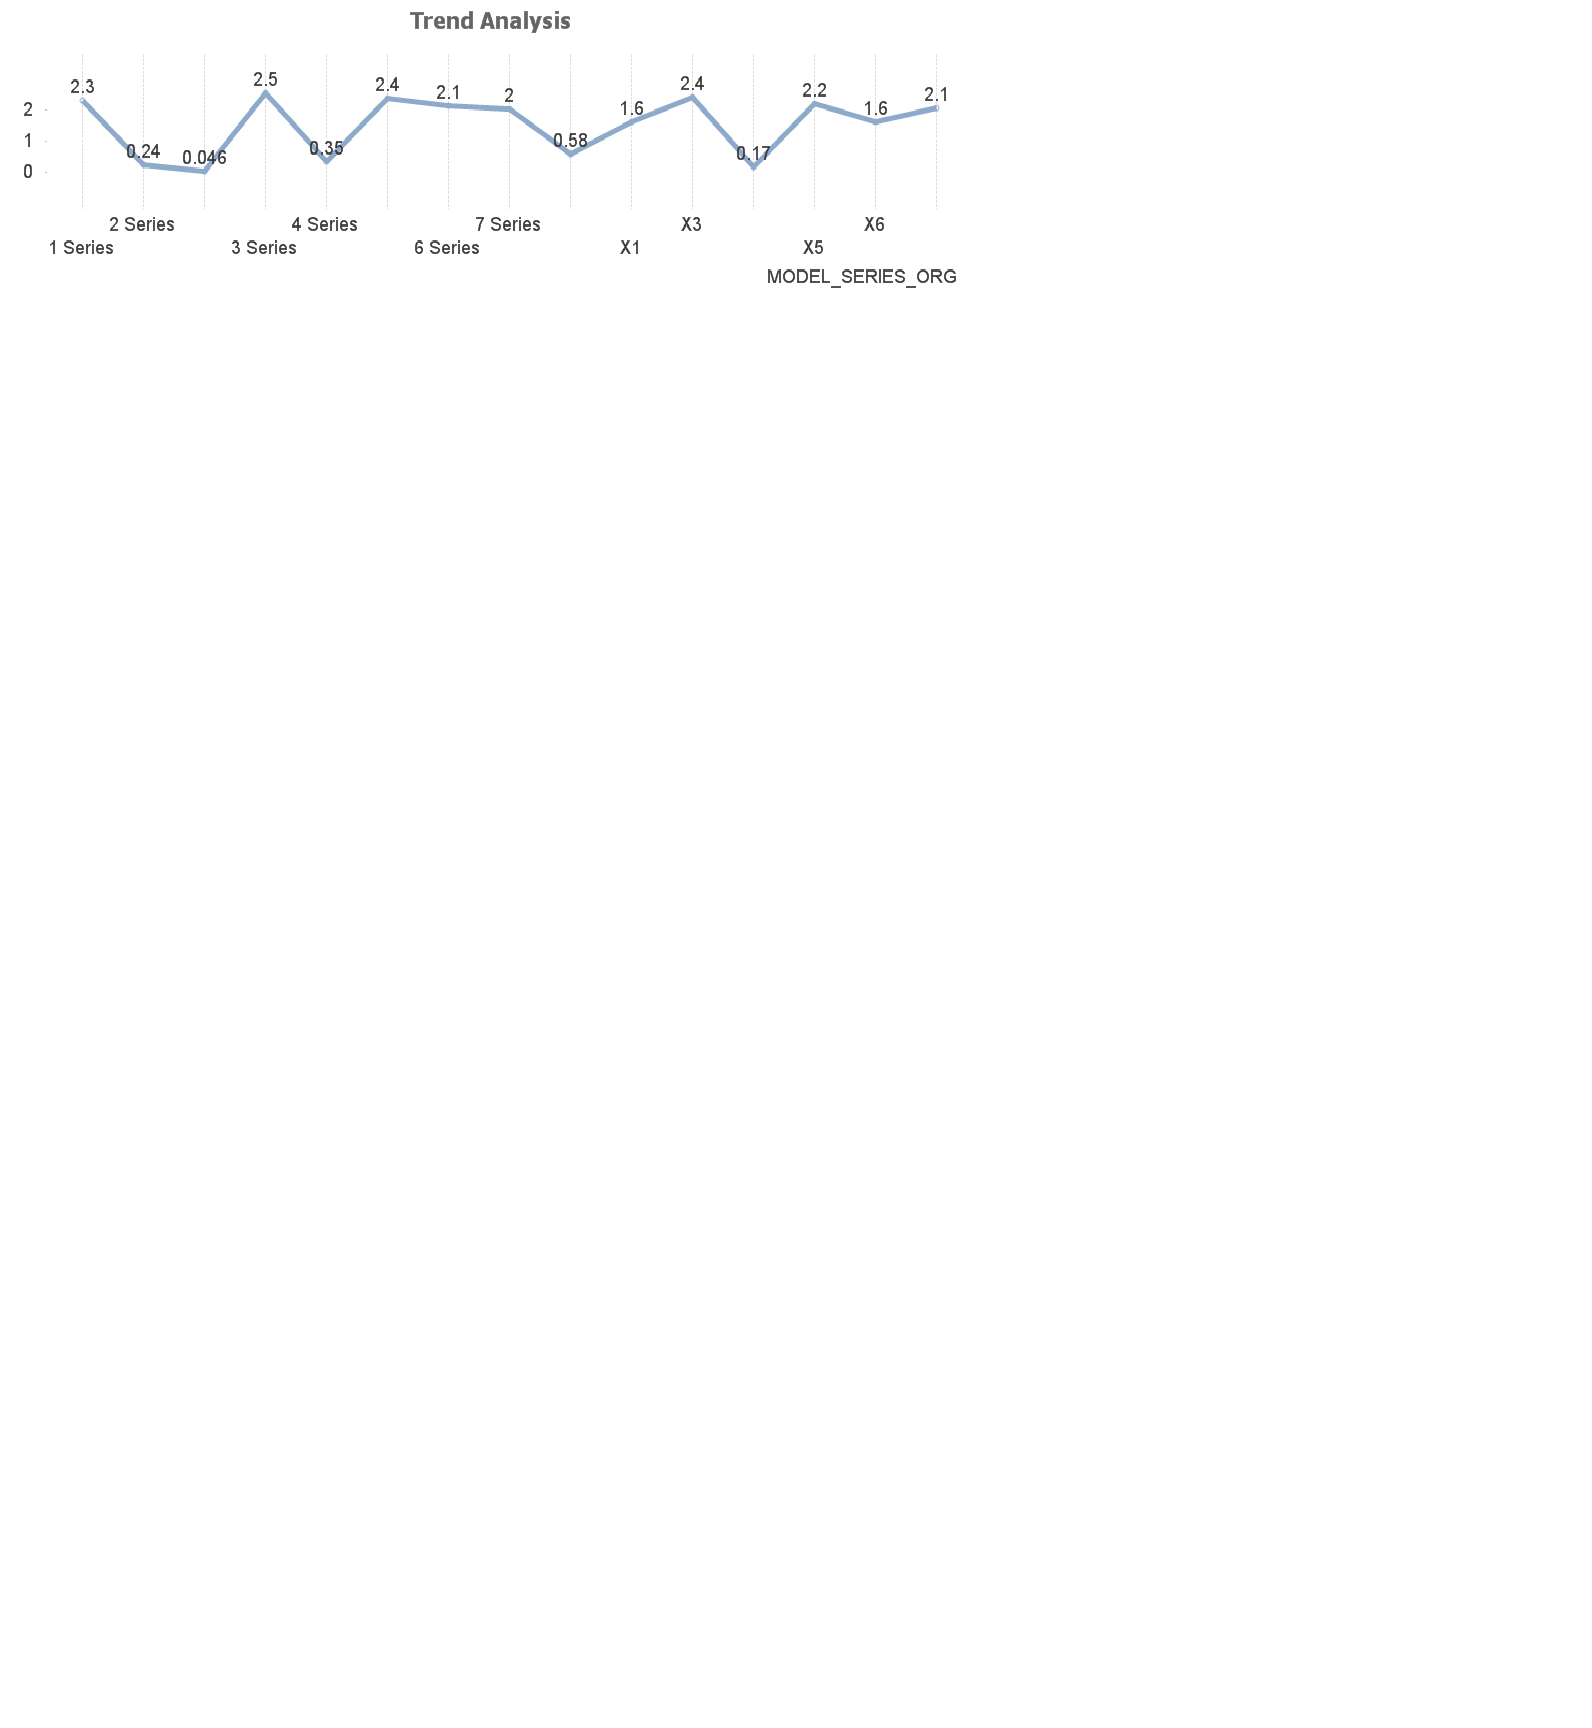
I'm stuck with a predicament, I was wondering how I would calculate a customers purchasing cycle and get a graph like this below if possible. However this time around I would get the different vehicle desciptions in the x-axis.

my data might be a problem at the moment since the repurchasing period needs to be calculated for each model and then the average of the purchasing cycle is calculated thereafter.
here is a sample of my data below:
| Business Partner | BP: First Name | BP: Surname | Vehicle Version | Vehicle Series | Vehicle Model | Description | Calendar day | Sales | |
| 10001696 | S | van Wyk | E32 | 7 | 7 SERIES | GA48 | 730i Sedan | 05/01/1988 | 1 |
| 10001696 | S | van Wyk | E32 | 7 | 7 SERIES | GA48 | 730i Sedan | 31/08/1990 | 1 |
| 10001696 | S | van Wyk | E32 | 7 | 7 SERIES | GA48 | 730i Sedan | 17/09/1991 | 1 |
| 10002228 | Ronald Charles | Russell | E32 | 7 | 7 SERIES | GB68 | 735i Sedan | 24/08/1992 | 1 |
| 10002302 | RIDWAN | JASAT | E65 | 7 | 7 SERIES | HL02 | 760i Sedan | 30/12/2009 | 1 |
| 10002302 | RIDWAN | JASAT | E65 | 7 | 7 SERIES | HL62 | 740i Sedan | 29/09/2006 | 1 |
| 10002370 | Brendan John | Traill | E32 | 7 | 7 SERIES | GA48 | 730i Sedan | 01/08/1996 | 1 |
I hope this makes sense.
Thanks in advance.
- Mark as New
- Bookmark
- Subscribe
- Mute
- Subscribe to RSS Feed
- Permalink
- Report Inappropriate Content
Oh Okay, I think I found a way but I need to find a way to make the calendar dates subtract from each other using the peek function. From then on I will create a chart with the description field as my dimension and I'll then average the newly crated [Repurchases] field. here is my code below:
Main:
LOAD [Business Partner],
[BP: First Name],
[BP: Surname],
[Vehicle Version],
[Vehicle Series],
F6,
[Vehicle Model],
Description,
date(date#([Calendar day],'dd/mm/yyyy')) as [Calendar day],
Sales
FROM
[BMW Repurchases.xlsx]
(ooxml, embedded labels, table is [BMW (65)]);
Find_Duplicates:
NoConcatenate
load *,
If([Business Partner] = Peek('[Business Partner]', -1),[Calendar day] - Peek('[Calendar day]', -1),0) as [Repurchases]
resident Main;
drop table Main;
Thanks in advance!
- Mark as New
- Bookmark
- Subscribe
- Mute
- Subscribe to RSS Feed
- Permalink
- Report Inappropriate Content
Would you be able to share what you have right now and what are you trying to get to?
- Mark as New
- Bookmark
- Subscribe
- Mute
- Subscribe to RSS Feed
- Permalink
- Report Inappropriate Content
Hi Sunny
Not sure my last message was delivered but what Im trying to saty is that the peek function isn't picking up the date field which is the [Calendar day] field hence the calculations aren't being done properly.
For instance if Sunny has bought multiple cars in say 2010 and 2011 then the difference should be 1 year hence thats what I am trying to do with the peek function for each [Business Partner] field.
Please see attached app.
Ultimately I want to get a graph as shown below, with the Description field as my dimension and the repurchases field as my calculation index.

- Mark as New
- Bookmark
- Subscribe
- Mute
- Subscribe to RSS Feed
- Permalink
- Report Inappropriate Content
I think try this code....
Main:
LOAD [Business Partner],
[BP: First Name],
[BP: Surname],
[Vehicle Version],
[Vehicle Series],
F6,
[Vehicle Model],
Description,
Date(Date#([Calendar day], 'DD/MM/YYYY')) as [Calendar day],
Sales
FROM
[BMW Repurchases.xlsx]
(ooxml, embedded labels, table is [BMW (65)]);
Find_Duplicates:
NoConcatenate
LOAD *,
If([Business Partner] = Peek('Business Partner'), [Calendar day] - Peek('Calendar day'), 0) as [Repurchases]
Resident Main
Order By [Business Partner];
DROP Table Main;
- Mark as New
- Bookmark
- Subscribe
- Mute
- Subscribe to RSS Feed
- Permalink
- Report Inappropriate Content
Not 100% sure, but you might need a sort on the Calendar day field as well:
Main:
LOAD [Business Partner],
[BP: First Name],
[BP: Surname],
[Vehicle Version],
[Vehicle Series],
F6,
[Vehicle Model],
Description,
Date(Date#([Calendar day], 'DD/MM/YYYY')) as [Calendar day],
Sales
FROM
[BMW Repurchases.xlsx]
(ooxml, embedded labels, table is [BMW (65)]);
Find_Duplicates:
NoConcatenate
LOAD *,
If([Business Partner] = Peek('Business Partner'), [Calendar day] - Peek('Calendar day'), 0) as [Repurchases]
Resident Main
Order By [Business Partner], [Calendar day];
DROP Table Main;
- Mark as New
- Bookmark
- Subscribe
- Mute
- Subscribe to RSS Feed
- Permalink
- Report Inappropriate Content
Hi Sunny
I see but this doesn't aggregate for each unique [business partner] field, this does the calculation for all the business partners irrelevant of the ID, and furthermore the calculation is in integer format such as 4996 whereas I want it as 4.6 years for instance.
- Mark as New
- Bookmark
- Subscribe
- Mute
- Subscribe to RSS Feed
- Permalink
- Report Inappropriate Content
You can do the aggregation on the front end using Sum() function. How is 4996 = 4.6 years?
- Mark as New
- Bookmark
- Subscribe
- Mute
- Subscribe to RSS Feed
- Permalink
- Report Inappropriate Content
From my understanding a date is interpreted as a numeric in qlikview hence I was just making a generic reference it wasn't even accurate, thanks Sunny!