Unlock a world of possibilities! Login now and discover the exclusive benefits awaiting you.
- Qlik Community
- :
- All Forums
- :
- QlikView App Dev
- :
- Re: Calculating an attrition rate
- Subscribe to RSS Feed
- Mark Topic as New
- Mark Topic as Read
- Float this Topic for Current User
- Bookmark
- Subscribe
- Mute
- Printer Friendly Page
- Mark as New
- Bookmark
- Subscribe
- Mute
- Subscribe to RSS Feed
- Permalink
- Report Inappropriate Content
Calculating an attrition rate
I would like to show a graph with the attrition rate for various departments.
I do have a table with the monthly headcounts dating back to April 2014 (our fiscal year starts in April).
I also have the number of employees that left the company on a monthly basis dating back to April 2014 in the following format:
| Period | Cost Centre | Leavers |
| 30.04.2014 | 512 | 2 |
| 31.05.2014 | 512 | 0 |
| … | ||
| 31.08.2015 | 512 | 1 |
| 30.09.2015 | 512 | 0 |
| 30.04.2014 | 200 | 0 |
| 31.05.2014 | 200 | 2 |
| … | 200 | 1 |
| 31.08.2015 | 200 | 3 |
| 30.09.2015 | 200 | 1 |
The chart should only start showing the values as per April 2015 and I want to have an annualized attrition rate. So for April 2015 the attrition rate should be calculated as follows:
SUM of all leavers between May 2014 and April 2015 for Department X
------------------------------------------------------------------------------------------------------ = Annual Attrition Rate in %
Average of Headcount between May 2014 and April 2015 for Department X
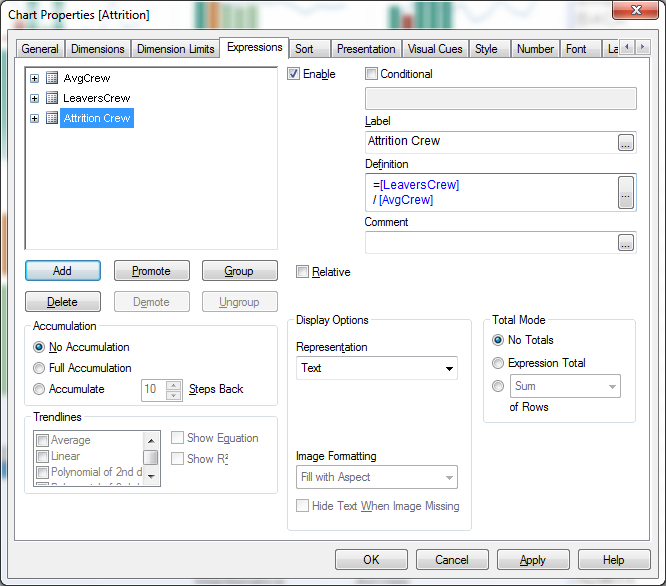
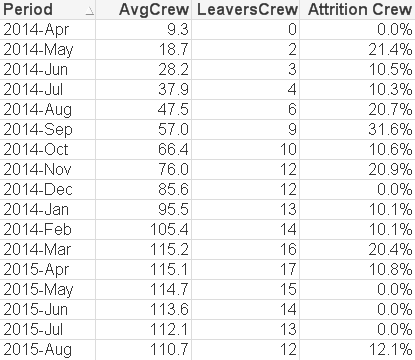
I managed to create a straight table that shows the Average Crew and Cumulative Leavers using the Accumulation of 12 Steps Back in the Expression. But this only works, if I also display the values for 2014. Yet, I do not want to show 2014 values, as these are not for a 12 month basis and therefore not comparable.
Furthermore, if I then try to divide the Leavers / AvgEmployees, I get values that I cannot reconcile.
I'm unsure if it would be easier to do an accumulation during the loading script, or if it would be possible to calculate this using a set analysis.
Thanks for any hints.
Accepted Solutions
- Mark as New
- Bookmark
- Subscribe
- Mute
- Subscribe to RSS Feed
- Permalink
- Report Inappropriate Content
Try like this once :
sum( aggr( rangesum( above(total sum({<Month=>}Sales),0,12) ),Month))
- Mark as New
- Bookmark
- Subscribe
- Mute
- Subscribe to RSS Feed
- Permalink
- Report Inappropriate Content
check this thread :
Calculating rolling n-period totals, averages or other aggregations
- Mark as New
- Bookmark
- Subscribe
- Mute
- Subscribe to RSS Feed
- Permalink
- Report Inappropriate Content
Thanks for your hint. I didn't see that post yet.
I was hoping that the sum( aggr( rangesum( above( sum(Sales),0,12) ),Month)) would do the trick, but it looks like that is not helping.
I'm a bit reluctant to go for the AsOf table, as it seems to be complicating things quite a bit if you don't have just a simple data model like in your example.
It's kinda disappointing that there isn't a simpler solution to such a common problem
- Mark as New
- Bookmark
- Subscribe
- Mute
- Subscribe to RSS Feed
- Permalink
- Report Inappropriate Content
Try like this once :
sum( aggr( rangesum( above(total sum({<Month=>}Sales),0,12) ),Month))
- Mark as New
- Bookmark
- Subscribe
- Mute
- Subscribe to RSS Feed
- Permalink
- Report Inappropriate Content
Hi Avinash
I had to try a bit more and your formula did the job:
That's what I have now and it calculates it correctly.
Sum(Aggr(RangeSum(Above(Total Sum({$<Month=>} Leavers),0,12)), Month))
Thank you very much!!
- Mark as New
- Bookmark
- Subscribe
- Mute
- Subscribe to RSS Feed
- Permalink
- Report Inappropriate Content
Hi Matthias,
Your always welcome with questions.. Happy learning 