Unlock a world of possibilities! Login now and discover the exclusive benefits awaiting you.
- Qlik Community
- :
- All Forums
- :
- QlikView App Dev
- :
- Re: Calculating difference between actual and mont...
- Subscribe to RSS Feed
- Mark Topic as New
- Mark Topic as Read
- Float this Topic for Current User
- Bookmark
- Subscribe
- Mute
- Printer Friendly Page
- Mark as New
- Bookmark
- Subscribe
- Mute
- Subscribe to RSS Feed
- Permalink
- Report Inappropriate Content
Calculating difference between actual and month before
Hello,
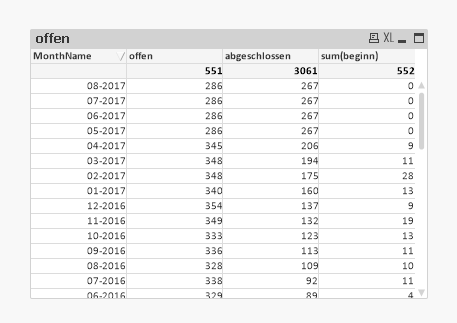
I have the Problem, that I want to see a development in a diagram. Is it possible to Show the monthly development in column 3 ("abgeschlossen")? Actually, in April 2017 there were 61 closed projects and I
1) only see the difference one month later which is bad
2) only see a total number where I want to see a calculated figure...
Any ideas?

Michael
- Mark as New
- Bookmark
- Subscribe
- Mute
- Subscribe to RSS Feed
- Permalink
- Report Inappropriate Content
There is not enough information as we are not aware as to what is breaking, from your script on the table to your load script
- Mark as New
- Bookmark
- Subscribe
- Mute
- Subscribe to RSS Feed
- Permalink
- Report Inappropriate Content
The data is correct, I just want to know if it is possible to subtract last month figures from actual.
Attached pls find the file.
- Mark as New
- Bookmark
- Subscribe
- Mute
- Subscribe to RSS Feed
- Permalink
- Report Inappropriate Content
try this:
count({<Status={"abgeschlossen"}>} DISTINCT [Projektnr. / Project No.]) -
below(count({<Status={"abgeschlossen"}>} DISTINCT [Projektnr. / Project No.]))
- Mark as New
- Bookmark
- Subscribe
- Mute
- Subscribe to RSS Feed
- Permalink
- Report Inappropriate Content
I actually tried it a bit differently:
(count({<Status={"abgeschlossen"}>} DISTINCT [Projektnr. / Project No.]) -
above(count({<Status={"abgeschlossen"}>} DISTINCT [Projektnr. / Project No.])))*-1
Thank you very much!![]()