Unlock a world of possibilities! Login now and discover the exclusive benefits awaiting you.
- Qlik Community
- :
- All Forums
- :
- QlikView App Dev
- :
- Calculating the percentage in Expressions
- Subscribe to RSS Feed
- Mark Topic as New
- Mark Topic as Read
- Float this Topic for Current User
- Bookmark
- Subscribe
- Mute
- Printer Friendly Page
- Mark as New
- Bookmark
- Subscribe
- Mute
- Subscribe to RSS Feed
- Permalink
- Report Inappropriate Content
Calculating the percentage in Expressions
Hello everyone,
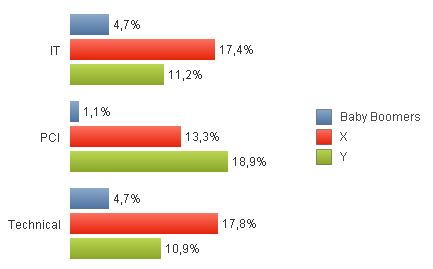
I am creating a bar chart which displays the total percentage of generations in some areas of the company.
The chart i created is showing the total percentage splited in each area, as you can see below:

I used 3 expressions to calculate the percentage:
sum({<[Generations]={"IT", "PCI", "Technical"}>} [Baby Boomers])
sum({<[Generations]={"IT", "PCI", "Technical"}>} X)
sum({<[Generations]={"IT", "PCI", "Technical"}>} Y)
Relative box is checked and numbers are formated in "Number" tab.
How can i calculate the percentage of generations for each area?? I need to display the total of Baby Boomers, X and Y inside IT, and then inside PCI and then inside Techincal.
I meant, the sum of Baby Boomers, X and Y of each area must be 100%.
Thanks
- Tags:
- new_to_qlikview
Accepted Solutions
- Mark as New
- Bookmark
- Subscribe
- Mute
- Subscribe to RSS Feed
- Permalink
- Report Inappropriate Content
Rodrigo,
also with this chart, I think it would be better to transform your data from a crosstable structure to a straight table using CROSSTABLE LOAD prefix as discussed in the other thread.
Then you would have three fields, Area, Generation and Value, and your chart would consist of two dimensions,
Area and Generation and a single expression
=Sum(Value) / Sum(Total<Area> Value)
Much simpler, right?
- Mark as New
- Bookmark
- Subscribe
- Mute
- Subscribe to RSS Feed
- Permalink
- Report Inappropriate Content
Try these:
Sum({<[Generations]={"IT", "PCI", "Technical"}>} [Baby Boomers]) / RangeSum(Sum(<Generations> {<[Generations]={"IT", "PCI", "Technical"}>} [Baby Boomers]), Sum(<Generations> {<[Generations]={"IT", "PCI", "Technical"}>} X), Sum(<Generations> {<[Generations]={"IT", "PCI", "Technical"}>} Y))
Sum({<[Generations]={"IT", "PCI", "Technical"}>} X) / RangeSum(Sum(<Generations> {<[Generations]={"IT", "PCI", "Technical"}>} [Baby Boomers]), Sum(<Generations> {<[Generations]={"IT", "PCI", "Technical"}>} X), Sum(<Generations> {<[Generations]={"IT", "PCI", "Technical"}>} Y))
Sum({<[Generations]={"IT", "PCI", "Technical"}>} Y) / RangeSum(Sum(<Generations> {<[Generations]={"IT", "PCI", "Technical"}>} [Baby Boomers]), Sum(<Generations> {<[Generations]={"IT", "PCI", "Technical"}>} X), Sum(<Generations> {<[Generations]={"IT", "PCI", "Technical"}>} Y))
- Mark as New
- Bookmark
- Subscribe
- Mute
- Subscribe to RSS Feed
- Permalink
- Report Inappropriate Content
Rodrigo,
also with this chart, I think it would be better to transform your data from a crosstable structure to a straight table using CROSSTABLE LOAD prefix as discussed in the other thread.
Then you would have three fields, Area, Generation and Value, and your chart would consist of two dimensions,
Area and Generation and a single expression
=Sum(Value) / Sum(Total<Area> Value)
Much simpler, right?
- Mark as New
- Bookmark
- Subscribe
- Mute
- Subscribe to RSS Feed
- Permalink
- Report Inappropriate Content
Hi Swuehl,
I tryed to do what you suggested, but something is wrong.
Take a look:
I have create the following Cross Table:
CrossTable (Generation, ValueGeneration, 2)
LOAD Areas,
Ano as [Ano Generations],
[Baby Boomers],
X,
Y
FROM
I am using "Generation" as a Dimension and a calculated Dimension to show Data only in the Areas i want:
if([Areas]<>'Farma Brazil*' and [Areas]<>'Regional', [Areas])
And below is the expression:
Sum(ValueGeneration) / Sum(Total<[Areas]> ValueGeneration)
But the numbers are not correct, see below:
Thanks
- Mark as New
- Bookmark
- Subscribe
- Mute
- Subscribe to RSS Feed
- Permalink
- Report Inappropriate Content
I have unchecked the "Relative" check box and it worked.
Thank you very much for your help again Swuehl.
Regards