Unlock a world of possibilities! Login now and discover the exclusive benefits awaiting you.
- Qlik Community
- :
- All Forums
- :
- QlikView App Dev
- :
- Re: Calculation Question
- Subscribe to RSS Feed
- Mark Topic as New
- Mark Topic as Read
- Float this Topic for Current User
- Bookmark
- Subscribe
- Mute
- Printer Friendly Page
- Mark as New
- Bookmark
- Subscribe
- Mute
- Subscribe to RSS Feed
- Permalink
- Report Inappropriate Content
Calculation Question
I'm not sure if this can be done due to the structure of my data but.......
I want to work out some average customer timelines. I have a static excel file with all the data on that lists each customer interaction.
On each line there are two customer unique ID codes that that customer has for life irrespective of the interactions we may have with them.
On the line there will also be a couple of location codes and a date/time stamp.
What i want to do is work out the length of time that customer has spent at a location (based on subtracting the timestamp from both lines) and then determine the average time that customers spend at that given location.
To make things more  complicated, customers may often bounce between locations and home and i won't know when they've gone home so i think i'll probably need to have a filter that says something like "if we cant find customer A after X number of days then ignore"
Is that making sense?
Below is a rough mock up of the data:
| Unique ID 1 | Unique ID 2 | ID | Date Stamp | Location A | Location B |
| 1234 | 5678 | John Smith | 03/10/2014 19:15 | Shop 1 | Shop 2 |
| 2345 | 6789 | Fred Jones | 03/10/2014 20:05 | Shop 2 | Shop 1 |
| 1234 | 5678 | John Smith | 05/10/2014 17:00 | Shop 2 | Shop 3 |
So in this example i would subtract the two John Smith date stamps and it would spit out an answer of 45 hours and 45 minutes for time spent at 'Shop 2' and i would then want to look at all of those results for 'Shop 2' and produce an average.
- « Previous Replies
-
- 1
- 2
- Next Replies »
- Mark as New
- Bookmark
- Subscribe
- Mute
- Subscribe to RSS Feed
- Permalink
- Report Inappropriate Content
Peter,
Is it important that JS's 1st entry Location B=JS's second entry Location A?
Cheers,
Chris.
- Mark as New
- Bookmark
- Subscribe
- Mute
- Subscribe to RSS Feed
- Permalink
- Report Inappropriate Content
Hi Chris,
So I’m trying to initially determine the length of time at that location. The first instance tells me when they left the 1st location and the 2nd instance tells me when they left the second location which can then give me the length of time at the second location.
From that I should be able to start to build up a while customer journey and generate stats on certain sections.
- Mark as New
- Bookmark
- Subscribe
- Mute
- Subscribe to RSS Feed
- Permalink
- Report Inappropriate Content
Hi Peter,
I looked at using above & interval in a straight table, and come up with a chart showing your 45 hours, but as soon as I make a selection on the location it falls away;
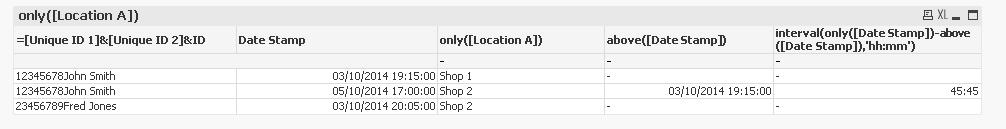
Might need something in script to get the start & end date/times in the same row, will have another look.
Cheers,
Chris.
- Mark as New
- Bookmark
- Subscribe
- Mute
- Subscribe to RSS Feed
- Permalink
- Report Inappropriate Content
Thanks Chris, I appreciate you taking a look.
It will ultimately be imported from excel to a sql database for QlikView to reload from if that makes it any easier?
Cheers,
Peter
- Mark as New
- Bookmark
- Subscribe
- Mute
- Subscribe to RSS Feed
- Permalink
- Report Inappropriate Content
Peter,
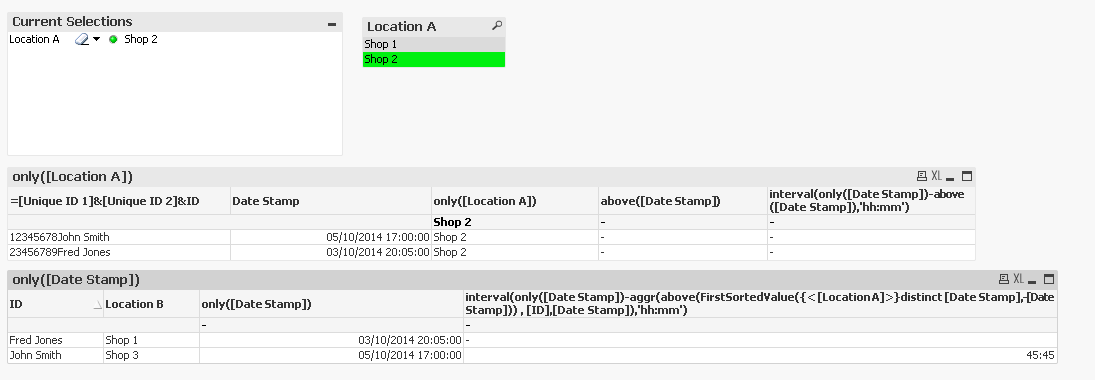
So I think a script solution will ultimately be more robust, but found this Filter Issue while using ABOVE Function & suggests this can be done in charts, with the bit in bold being where the selection on location is taken out (so if you have other possible selections that may need extended);
interval(only([Date Stamp])-aggr(above(FirstSortedValue({< [Location A]>}distinct [Date Stamp],-[Date Stamp])) , [ID],[Date Stamp]),'hh:mm')
Giving;
Cheers,
Chris.
- Mark as New
- Bookmark
- Subscribe
- Mute
- Subscribe to RSS Feed
- Permalink
- Report Inappropriate Content
Hi Peter,
In terms of fixing upstream (as in not in the charts), you mention SQL that gives you (at least these) options;
1) You could join the date from record before into a new column on the SQL table
2) You could create a SQL view that did the join between the table and itself
3) You could use a SSAS model & join in that
4) Still do join in QlikView, but in script sorting your load & using if & previous function https://help.qlik.com/en-US/sense/September2018/Subsystems/Hub/Content/Sense_Hub/Scripting/InterReco...
There will be advantages and disadvantages to all of these, would depend on your circumstances/preference.
Cheers,
Chris.
- Mark as New
- Bookmark
- Subscribe
- Mute
- Subscribe to RSS Feed
- Permalink
- Report Inappropriate Content
Hi,
Here is my sample script that i used to analyse Access Control System data. Its looks like similar with your requirements.
Data structure is:
DateTime, Day, Time, User, InOut
//Creating additional measures for length between IN and OUT event per User, per Day
LOAD
*,
if(InOut='Out' and Peek(InOut)='In', Interval([Time]-peek([Time]),'hh:mm'), Null()) as WorkInterval,
if(InOut='In' and Peek(InOut)='Out', Interval([Time]-peek([Time]),'hh:mm'), Null()) as PauseInterval
Resident Tab
Order by Day, User, [Time];
...
// Calculate User indicators
Persons:
NoConcatenate LOAD
User,
Count(DISTINCT [Day]) as VisitDays,
Count(DISTINCT [Day])/$(vTotalDaysCount) as Attendance
Resident Int
Group by [User];
So i use Attendance value to determine office workers and another staff. (Ex: Attendance > 0.7)
Hope it helps!
- Mark as New
- Bookmark
- Subscribe
- Mute
- Subscribe to RSS Feed
- Permalink
- Report Inappropriate Content
Ok,
I'll take a look at the link you posted and see if that works. The data itself is in the correct date/time order so it shouldn't be too difficult. As for the first three suggestions i'll have to get my SQL books out and remind myself how to do things in there as its been far too long since I've done anything clever with SQL.
If anything else springs to mind then please feel free to post back.
Thanks,
Peter
- Mark as New
- Bookmark
- Subscribe
- Mute
- Subscribe to RSS Feed
- Permalink
- Report Inappropriate Content
Hi Zhandos,
sorry I didn't receive the notification for this.
I'll have a look now at what you've suggested and see if I can work it out. I'm presuming I just add this to the bottom of my script (once I've adapted it to have my field labels).
- « Previous Replies
-
- 1
- 2
- Next Replies »