Unlock a world of possibilities! Login now and discover the exclusive benefits awaiting you.
- Qlik Community
- :
- All Forums
- :
- QlikView App Dev
- :
- Re: Calculation of vehicles types (or anything)
- Subscribe to RSS Feed
- Mark Topic as New
- Mark Topic as Read
- Float this Topic for Current User
- Bookmark
- Subscribe
- Mute
- Printer Friendly Page
- Mark as New
- Bookmark
- Subscribe
- Mute
- Subscribe to RSS Feed
- Permalink
- Report Inappropriate Content
Calculation of vehicles types (or anything)
Hi all.
Please look at attached pic.
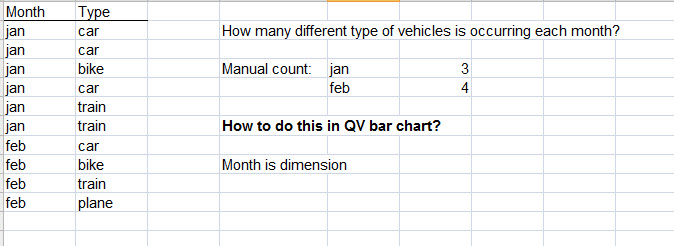
I would like to know how to make this happen in QV.
Best regards
/Mats
- Tags:
- new_to_qlikview
Accepted Solutions
- Mark as New
- Bookmark
- Subscribe
- Mute
- Subscribe to RSS Feed
- Permalink
- Report Inappropriate Content
Hi,
Try this in QV
Create a chart with dimension as Month and expression as count(distinct Type)
Regards,
Kaushik Solanki
- Mark as New
- Bookmark
- Subscribe
- Mute
- Subscribe to RSS Feed
- Permalink
- Report Inappropriate Content
Hi,
Try this in QV
Create a chart with dimension as Month and expression as count(distinct Type)
Regards,
Kaushik Solanki
- Mark as New
- Bookmark
- Subscribe
- Mute
- Subscribe to RSS Feed
- Permalink
- Report Inappropriate Content
IN CHART ADD DIMENSION
MONTH
AND EXPRESSION
COUNT(DISTINCT(TYPE))
hOPE IT HELPS YOU
- Mark as New
- Bookmark
- Subscribe
- Mute
- Subscribe to RSS Feed
- Permalink
- Report Inappropriate Content
Hi again and thanks for the quick answer!
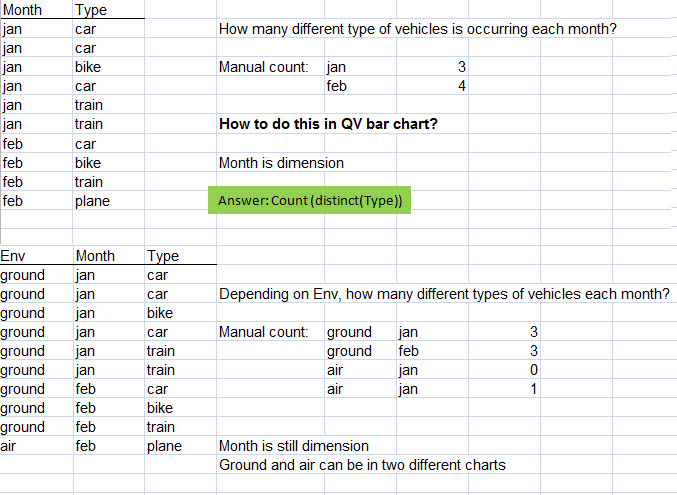
I have to ask again, this time with a third column to concider:
Thanks in advance
/Mats
- Mark as New
- Bookmark
- Subscribe
- Mute
- Subscribe to RSS Feed
- Permalink
- Report Inappropriate Content
Hi,
Only include Env as dimension.
Regards,
Kaushik Solanki
- Mark as New
- Bookmark
- Subscribe
- Mute
- Subscribe to RSS Feed
- Permalink
- Report Inappropriate Content
Hi
Ok, now im getting there! 
I have now a formula that is: if(Env='ground',count (distinct (Type)))
This is working fine and with the real table i get 3 as the answer.
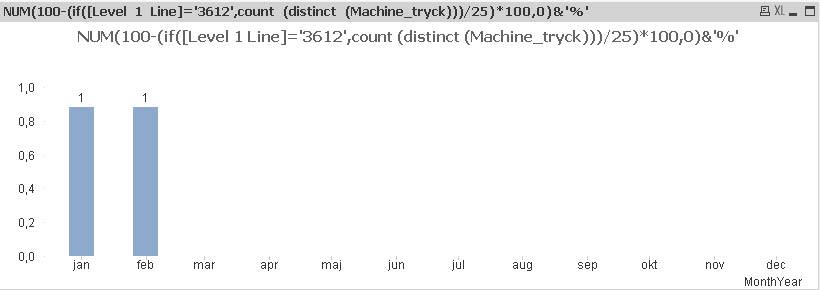
Now i want to calculate it in percent where i have 25 different Type.
I set it up like this:
NUM(100-(if(Env='ground',count (distinct (Type)))/25)*100,0)&'%'
but then i don't get it right. The answer should be 88%
/Mats
- Mark as New
- Bookmark
- Subscribe
- Mute
- Subscribe to RSS Feed
- Permalink
- Report Inappropriate Content
Hi again
I got it!
I had to present the number as Percent and then everything fell in place!
Best regards
/Mats