Unlock a world of possibilities! Login now and discover the exclusive benefits awaiting you.
- Qlik Community
- :
- All Forums
- :
- QlikView App Dev
- :
- Calling a sheet object in a variable
- Subscribe to RSS Feed
- Mark Topic as New
- Mark Topic as Read
- Float this Topic for Current User
- Bookmark
- Subscribe
- Mute
- Printer Friendly Page
- Mark as New
- Bookmark
- Subscribe
- Mute
- Subscribe to RSS Feed
- Permalink
- Report Inappropriate Content
Calling a sheet object in a variable
I asked this question in another thread, but it deserves it's own thread, I think.
Is there a way to point to an object ID, and then a column in that object, in a variable?
Something like:
= (ObjectID(ColumnNumber)) ?
- Mark as New
- Bookmark
- Subscribe
- Mute
- Subscribe to RSS Feed
- Permalink
- Report Inappropriate Content
Hi,
You can try with getcell function..
I am not yet tried it.
This below example I got it from API guide:
set table = ActiveDocument.GetSheetObject( "CH01" )
for RowIter = 0 to table.GetRowCount-1
for ColIter =0 to table.GetColumnCount-1
set cell = table.GetCell(RowIter,ColIter)
msgbox(cell.Text)
next
next
Karthik
- Mark as New
- Bookmark
- Subscribe
- Mute
- Subscribe to RSS Feed
- Permalink
- Report Inappropriate Content
By writing macro , Its working..
Sub StraightTableCell
set table = ActiveDocument.GetSheetObject( "CH01" )
set cell = table.GetCell(1,1)
msgbox(cell.Text)
End Sub
- Mark as New
- Bookmark
- Subscribe
- Mute
- Subscribe to RSS Feed
- Permalink
- Report Inappropriate Content
Karthiks, could you break down exactly what that is doing?
I have a straight table called "RC", and the field is "column(10)", if you can possibly use that info and show me how to do it?
- Mark as New
- Bookmark
- Subscribe
- Mute
- Subscribe to RSS Feed
- Permalink
- Report Inappropriate Content
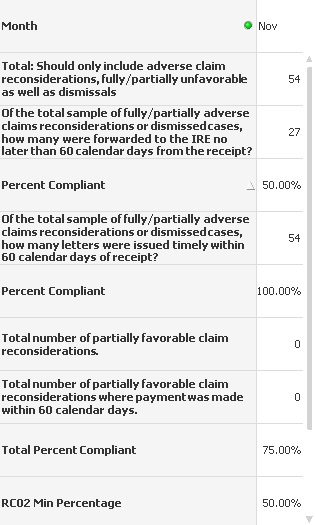
Here's a picture of the table I'm referring to.
See the "RC02 Min Percentage" cell? That does a calculation to determine the lowest percentage value of all the values in the table.
I need to call to that, in a bar chart. I have about 10 of these straight tables, and I need to show each table's lowest percentage value inside of the bar chart.
I'm hoping there's a way to set a variable to that table's cell (which is called column(10)), and then call the variable inside of the bar chart.
- Mark as New
- Bookmark
- Subscribe
- Mute
- Subscribe to RSS Feed
- Permalink
- Report Inappropriate Content
I guess my question is, how does the variable know which table I'm talking about?
In the "RC02 Min Percentage" column, the expression just says "if ((Column(3)<=Column(5)), Column(3), Column(5))"... It's a simple if statement to pull the min value down.
If I put that in the variable, it won't know which of my 10 tables I'm talking about. They all have columns.
Is there a better, more distinct way to do the min, that the variable would know which fields I'm speaking of, in which tables?
- Mark as New
- Bookmark
- Subscribe
- Mute
- Subscribe to RSS Feed
- Permalink
- Report Inappropriate Content
It doesn't. If you want to reuse an expression don't use column references. Use variables that are chart (-layout) independant. For example:
vExpr1: sum(Value1)
vExpr2: sum(Value2)
vExpr3: rangemax( $(vExpr1), $(vExpr2))
Column3: $(vExpr1)
Column5: $(vExpr2)
RC02 Min Percentage: $(vExpr3)
An expression in some other chart: $(vExpr3). If that chart uses the same dimensions it will return the same value.
edit:
The $ is to force evaluation of the variable. It's called dollar expansion. You can see how that works by trying it out in a text box =vVariance versus =$(vVariance).
talk is cheap, supply exceeds demand
- Mark as New
- Bookmark
- Subscribe
- Mute
- Subscribe to RSS Feed
- Permalink
- Report Inappropriate Content
okay I think I see what you're saying - could you humor me, and tell me how I would set it up, in my example?
I'm pretty confused when it comes to variables and how to set them up, and I'm only about 2 weeks new to Qlikview. lol.
Would I make a variable for column 3 and 5, and put the same expression I now have in those columns inside of the variable?
Does the $ make the variable know it's a value I'm returning, I think?
Then, I can call to the variable in my bar chart, and return the value in the variable?
Thanks a ton for this, by the way.