Unlock a world of possibilities! Login now and discover the exclusive benefits awaiting you.
- Qlik Community
- :
- All Forums
- :
- QlikView App Dev
- :
- Re: Can I combine these two graphs in one object?
- Subscribe to RSS Feed
- Mark Topic as New
- Mark Topic as Read
- Float this Topic for Current User
- Bookmark
- Subscribe
- Mute
- Printer Friendly Page
- Mark as New
- Bookmark
- Subscribe
- Mute
- Subscribe to RSS Feed
- Permalink
- Report Inappropriate Content
Can I combine these two graphs in one object?
Hi QlikView Community!
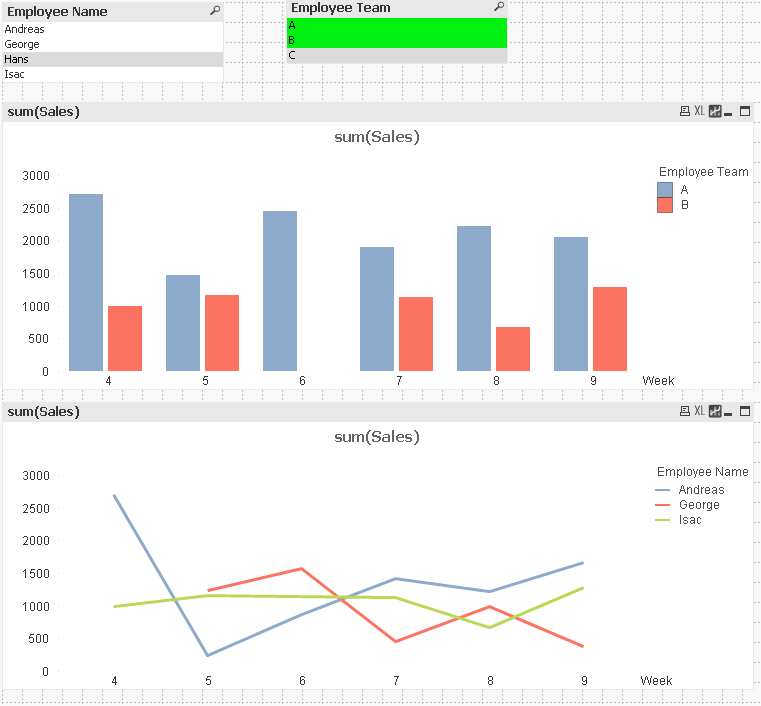
My objective is to combine two graphs in one object.
I created a sample to demonstrate, attached.
Screenshot:
I hope it is possible.
Brgds, Alex
Accepted Solutions
- Mark as New
- Bookmark
- Subscribe
- Mute
- Subscribe to RSS Feed
- Permalink
- Report Inappropriate Content
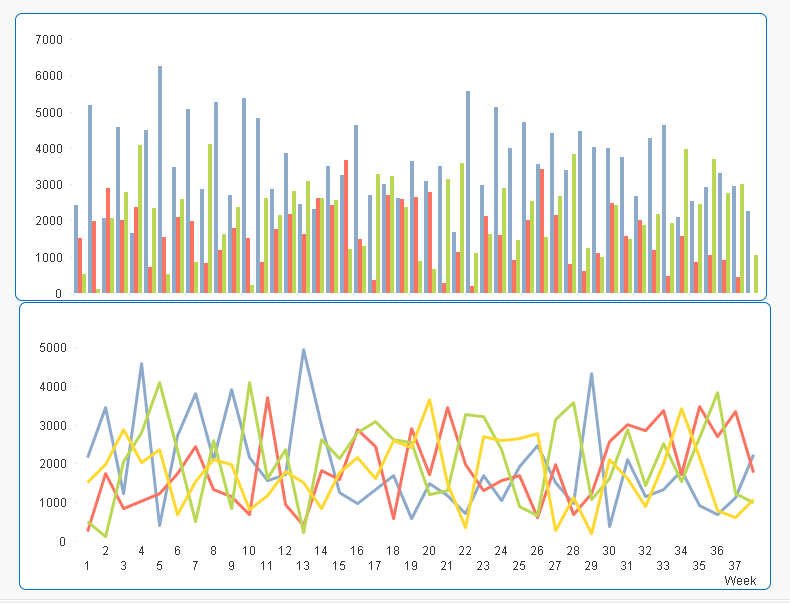
May be something like this:
Layered one chart on the other with some formatting changes to make sure they don't look like two charts.

- Mark as New
- Bookmark
- Subscribe
- Mute
- Subscribe to RSS Feed
- Permalink
- Report Inappropriate Content
The problem is that they have a different second dimension. This will prevent you from putting them in a single chart.
But if you create a cyclic group with Employee Name and Employee Team, you could flip between the two dimensions. You could also use a combo chart with conditional display of bars for the one and lines for the other (as long as that is not confusing to your users). Use GetCurrentField() in the expression conditionals to control which expression(s) should display for which cyclic value.
- Mark as New
- Bookmark
- Subscribe
- Mute
- Subscribe to RSS Feed
- Permalink
- Report Inappropriate Content
Depending on what you are trying to do, you can add the employee name as a third dimension to the bar chart. This will give you totals by time within week, and a breadkup of the individual within each team - see attched
cycle groups with the 2 different dimenstions as mentioned earlier would work as well
- Mark as New
- Bookmark
- Subscribe
- Mute
- Subscribe to RSS Feed
- Permalink
- Report Inappropriate Content
May be something like this:
Layered one chart on the other with some formatting changes to make sure they don't look like two charts.
- Mark as New
- Bookmark
- Subscribe
- Mute
- Subscribe to RSS Feed
- Permalink
- Report Inappropriate Content
Hi Alex,
As per my knowledge it is simple to Remove borders and Hide the the Title of chart so that front end view seems like these are one chart only
May be it will help to u
else please ignore this
- Mark as New
- Bookmark
- Subscribe
- Mute
- Subscribe to RSS Feed
- Permalink
- Report Inappropriate Content
This can be very confusing to users. If they try to click on the bar (on the "behind" chart), they are likely to select a line instead. Selections of an employee or employee group could also cause the two to rescale to a different values so they no longer align.
So for this to work well you normally need to make them read-only and/or ignore selections in all the expressions and/or use suitable calculated scaling expressions in the axis tabs for the two charts.
- Mark as New
- Bookmark
- Subscribe
- Mute
- Subscribe to RSS Feed
- Permalink
- Report Inappropriate Content
I agree, its not the best of ways to create this chart, but its a work around and can be explored more to see if it gives Alex what he wants 
- Mark as New
- Bookmark
- Subscribe
- Mute
- Subscribe to RSS Feed
- Permalink
- Report Inappropriate Content
Hi Adam.
Thanks for your really great example, I really liked it.
- Mark as New
- Bookmark
- Subscribe
- Mute
- Subscribe to RSS Feed
- Permalink
- Report Inappropriate Content
Sunny,
is there anyway to do two graphs in one Graph. My problem is if i am moving any one graph i want to move two graphs ..