Unlock a world of possibilities! Login now and discover the exclusive benefits awaiting you.
- Qlik Community
- :
- All Forums
- :
- QlikView App Dev
- :
- Can i ignore user selections in a single bar in a ...
- Subscribe to RSS Feed
- Mark Topic as New
- Mark Topic as Read
- Float this Topic for Current User
- Bookmark
- Subscribe
- Mute
- Printer Friendly Page
- Mark as New
- Bookmark
- Subscribe
- Mute
- Subscribe to RSS Feed
- Permalink
- Report Inappropriate Content
Can i ignore user selections in a single bar in a bar chart without using sum
I have a single bar in a bar chart that uses a variable with a stored expression in the expression field. I need to restrict the user selections to only 3 filters so that if any filters other than those are clicked, the expression = 0.
So the logic is if(SubRegion selected or Quarter selected or GBU selected, $(vTarget), 0)
I also need it to calculate vTarget if no fields are selected. There are many fields I want left out so I would prefer not to use {<field1=,field2=, etc>} if I can avoid it.
The problem I've run into is that all the examples I've come across to do this use sum() and when I do that the $(vTarget) returns the wrong number. I have tried using DISTINCT($(vTarget) but again, the number returns wrong. is there a way to specify exclusions (or inclusions) using my variable without using Sum()?
- « Previous Replies
-
- 1
- 2
- Next Replies »
Accepted Solutions
- Mark as New
- Bookmark
- Subscribe
- Mute
- Subscribe to RSS Feed
- Permalink
- Report Inappropriate Content
I was able to figure this out 
=if((getSelectedCount(field1)>0
or getSelectedCount(field2)>0
or getSelectedCount(field3)>0
..etc...),0,$vTarget))
Unfortunately I had to list several field names but it is working perfectly. Thank you for all your suggestions!
- Mark as New
- Bookmark
- Subscribe
- Mute
- Subscribe to RSS Feed
- Permalink
- Report Inappropriate Content
You can start with the global set of data (rather than current selections) and apply the filters you need.
sum ( {1} Sales) -> returns the sum of sales for the entire data model regardless of any user selection
sum ( {1<Year={$(=Only(Year))} Sales) -> returns the sum of sales for the entire data model regardless of any user selection except for Year which will be filtered to the value of vYear.
In the latter situation Year is equal to the user's selection of Year (if they have made one).
The syntax is easier working this way to add a small number of filters rather than exlcude the vast majority of field filters.
- Mark as New
- Bookmark
- Subscribe
- Mute
- Subscribe to RSS Feed
- Permalink
- Report Inappropriate Content
ok I tried this and it's not showing anything, even when I click the allowed filters. Did I type something wrong in the syntax?
=sum({1<SubRegion={$(=only(SubRegion))},Quarter={$(=only(Quarter))},GBU={$(=only(GBU))}>} $(vTarget))
- Mark as New
- Bookmark
- Subscribe
- Mute
- Subscribe to RSS Feed
- Permalink
- Report Inappropriate Content
Maybe you can try with alternate states, it's a little bit complicated to use but i think this is the solution for your problem.
If you attach a model (qvw) i could try to help you with an example using your data model.
Regards!
- Mark as New
- Bookmark
- Subscribe
- Mute
- Subscribe to RSS Feed
- Permalink
- Report Inappropriate Content
Hi
You can try the following expression:
= IF($(='RANGESUM(' & CONCAT({1<$Field -={"SubRegion", "Quarter", "GBU"}>} 'GETSELECTEDCOUNT([' & $Field & '])', ',')& ')') = 0 AND $(='RANGESUM(' & CONCAT({1<$Field ={"SubRegion", "Quarter", "GBU"}>} 'GETSELECTEDCOUNT([' & $Field & '])', ',')& ')') > 0, $(vTarget), 0)
Cheers
- Mark as New
- Bookmark
- Subscribe
- Mute
- Subscribe to RSS Feed
- Permalink
- Report Inappropriate Content
Its looks ok, but it won't work if the selected value for subregion , quarter or gbu has any spaces in the value. In this situation you would need to add single quotes into the SET MODIFIERs as follows:
=sum({1<SubRegion={'$(=only(SubRegion))'},Quarter={'$(=only(Quarter))'},GBU={'$(=only(GBU))'}>} $(vTarget))
Also, this won't return anything unless there is only one selected value of all 3 of these fields too.
But if you have all that and its still not working, the next question is what does is the expression for vTarget ?
- Mark as New
- Bookmark
- Subscribe
- Mute
- Subscribe to RSS Feed
- Permalink
- Report Inappropriate Content
This formula now works when I choose one of all three filters however, I need it to work when none, one, two, OR all three of the filters are chosen. There will typically only be one choice per filter so that is not an issue.
On another note, is there a reason we can't copy text into here? my formula for vTarget is really long and retyping it is a big pain!!
the formula uses fieldvalue and fieldindex to look up values in a table and match them to the user selection, then return the value for the target.
vTarget=Right(FieldValue('Target',FieldIndex('Condition',if(IsNull(SubRegion)=0,SubRegion,'')&if(isNull(Quarter)=0,Quarter,'')&if(IsNull(GBU)=0,GBU,'')))........
the rest uses len to remove the extraneous data put in for sort order (please forgive any syntax errors as I had to retype and may have missed something)
when I use Sum() with this formula it returns the wrong numbers - maybe because it is adding up all conditions that include that filter? this is why I would like to avoid using sum() if possible
- Mark as New
- Bookmark
- Subscribe
- Mute
- Subscribe to RSS Feed
- Permalink
- Report Inappropriate Content
Try this instead. If only 1 field has a selection it will filter for that selection and include all possible values from the other 2.
When taking this approach, you may also want to only render the chart (chart properties -> layout tab - > Show/Condition) if at least one of these 3 dimensions has one selected value. This condition will render the chart if there there is one and only one value selected for 1,2 or all 3 of the dimensions.
getselectedcount(SubRegion)=1 or getselectedcount(Quarter)=1 or getselectedcount(GBU)=1
---------
=sum(
{1<
SubRegion={'$(=concat(Distinct SubRegion, chr(39) & ',' & chr(39) ) )'},
Quarter={'$(=concat(Distinct Quarter, chr(39) & ',' & chr(39) ) )'},
GBU={'$(=concat(Distinct GBU, chr(39) & ',' & chr(39) ) )'}
>}
$(vTarget))
- Mark as New
- Bookmark
- Subscribe
- Mute
- Subscribe to RSS Feed
- Permalink
- Report Inappropriate Content
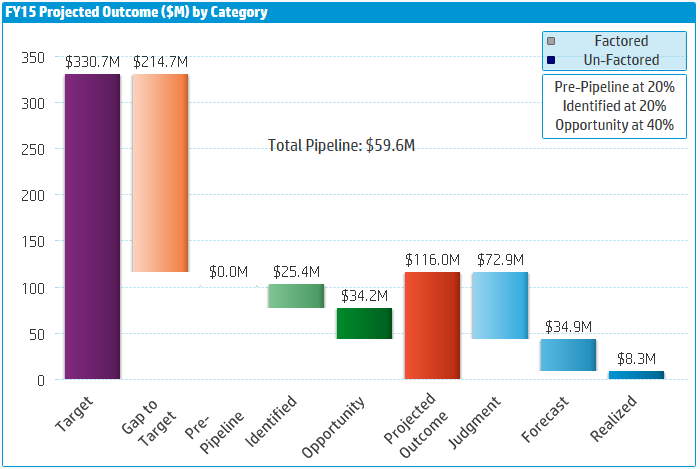
Here is a picture of the bar chart I am working with. I need the Target and Gap to Target bars to go away if any filters are clicked other than the three previously mentioned. The reasoning is that it gives a misleading picture of the target if (for example) someone clicked on Account, because it would show an inflated target for that Account when in reality it is the target for the entire region (or whatever).
So in theory this conditional statement works, except I only want that condition on the Target and Gap bars in the chart, not the entire chart. The rest of the bars need to change according to the filters selected and they all display correctly.
I tried putting the condition in just those bars in the early stages of creating this chart but the problem is the entire bars go away and they all shift over. I don't want this to happen, I want the bars to zero out so everything else in the chart stays as it is. This is why I was attempting an if statement that set the bar values to zero as the else part of the statement, that way the placeholder is still there for aesthetic purposes but the value is gone so there is no misleading data. is there a way to use the conditional statement and lock the rest of the bars to keep them from moving over? If so, that would completely solve my problem!! Oh if it could only be that easy!!
The second part of your response is helpful but the problem I'm having is that the vTarget numbers come back wrong.
For example = vTarget with no filters applied should return 330.7 (as shown above), however whenever I use it with Sum(), I get 1.442e + 004
I tried adding DISTINCT($(vTarget)) and the numbers are much more normal but only correct about 30% of the time.
- Mark as New
- Bookmark
- Subscribe
- Mute
- Subscribe to RSS Feed
- Permalink
- Report Inappropriate Content
Is the X axis a series of expressions or are they values from a chart dimension ?
For expressions, the bars disappear by default when the values are zero or null. You can uncheck that on the presentation tab properties (suppress zeroes, missing etc..)
If they are dimensions the setting is controlled on the dimensions tab. You could enforce 'show all values' for example.
Do those help ?
Lets figure that out first
- « Previous Replies
-
- 1
- 2
- Next Replies »