Unlock a world of possibilities! Login now and discover the exclusive benefits awaiting you.
- Qlik Community
- :
- All Forums
- :
- QlikView App Dev
- :
- Re: Can't Get $ to Show Up On Stacked Bar Chart
- Subscribe to RSS Feed
- Mark Topic as New
- Mark Topic as Read
- Float this Topic for Current User
- Bookmark
- Subscribe
- Mute
- Printer Friendly Page
- Mark as New
- Bookmark
- Subscribe
- Mute
- Subscribe to RSS Feed
- Permalink
- Report Inappropriate Content
Can't Get $ to Show Up On Stacked Bar Chart
I have a QV dashboard that uses both Grouped and Stacked horizontal bar charts. I want to display the Values next to bars in both.
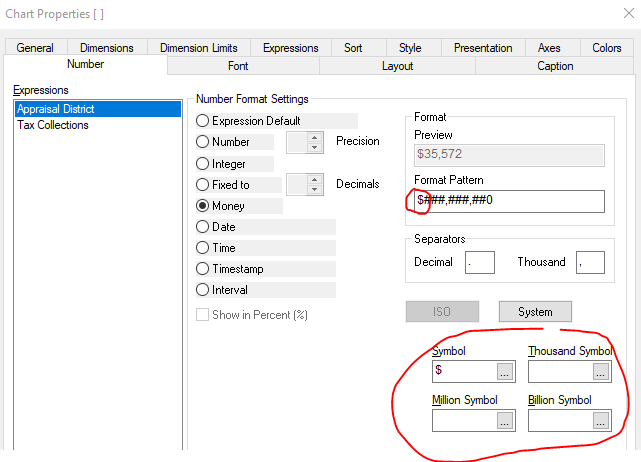
So on both charts, in chart Properties, Number tab, I include the $ sign in the Format Pattern, and in the Symbol box, leaving the Thousand, Million, and Billion symbol blank.
I then indicate on the Expressions tab to display Values on the Data Points.

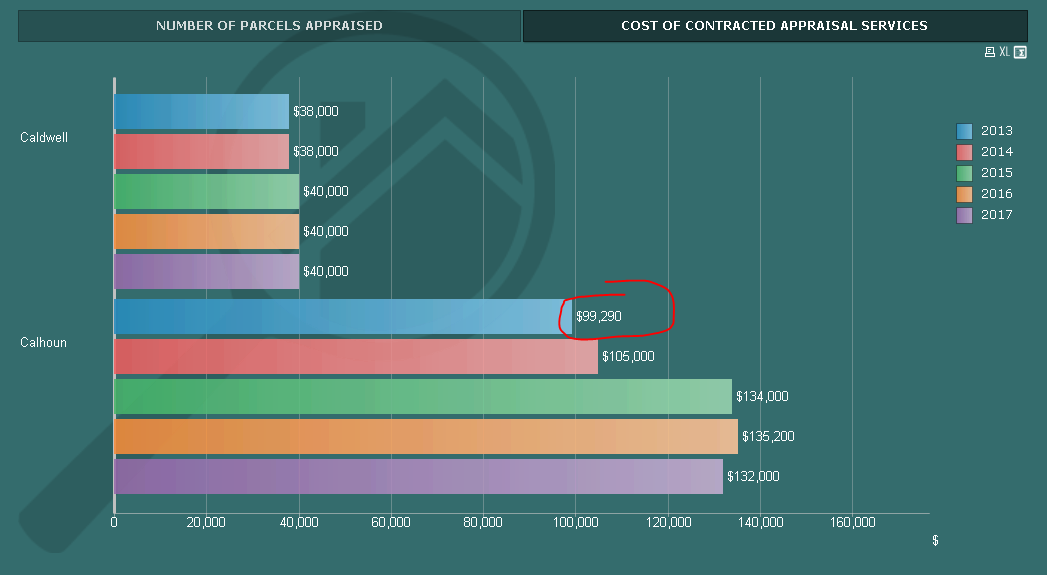
Here's how the Grouped bar chart displays the Values. Note the $ sign in front of the number. Perfect.
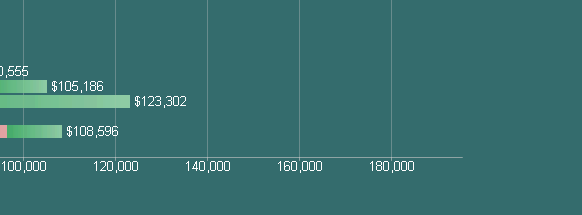
Here's how the Stacked bar chart looks. It totals the two categories, BUT WHERE IS THE $ SIGN?

Can anyone tell me how to fix this? It seems like such a simple thing, to include the $ on a value.
Thanks for your help,
Russell
- Tags:
- $ missing on value
Accepted Solutions
- Mark as New
- Bookmark
- Subscribe
- Mute
- Subscribe to RSS Feed
- Permalink
- Report Inappropriate Content
Take the $ out of the Symbol and it should work.
- Mark as New
- Bookmark
- Subscribe
- Mute
- Subscribe to RSS Feed
- Permalink
- Report Inappropriate Content
Take the $ out of the Symbol and it should work.
- Mark as New
- Bookmark
- Subscribe
- Mute
- Subscribe to RSS Feed
- Permalink
- Report Inappropriate Content
Thanks Lisa! That made the $ appear in the values on the data points, though it dropped off on the legend at lower right. It's the lesser of two evils so I'll take it! Thanks again.
- Mark as New
- Bookmark
- Subscribe
- Mute
- Subscribe to RSS Feed
- Permalink
- Report Inappropriate Content