Unlock a world of possibilities! Login now and discover the exclusive benefits awaiting you.
- Qlik Community
- :
- All Forums
- :
- QlikView App Dev
- :
- Re: Can we create two needles in guage chart?
- Subscribe to RSS Feed
- Mark Topic as New
- Mark Topic as Read
- Float this Topic for Current User
- Bookmark
- Subscribe
- Mute
- Printer Friendly Page
- Mark as New
- Bookmark
- Subscribe
- Mute
- Subscribe to RSS Feed
- Permalink
- Report Inappropriate Content
Can we create two needles in guage chart?
Hi Guys,
Good Morning !
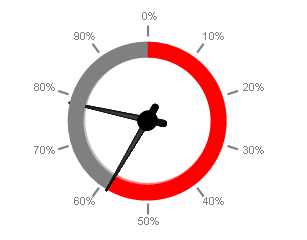
I have a requirement, where I am using Guage Chart. Can I show two needles for one Guage Chart, keeping one Needle to be static (based on Average of calculation) and use second needle to show changes based on filter criteria
Appreciate your Response !
Regards,
Varun. K
- Tags:
- new_to_qlikview
- « Previous Replies
-
- 1
- 2
- Next Replies »
- Mark as New
- Bookmark
- Subscribe
- Mute
- Subscribe to RSS Feed
- Permalink
- Report Inappropriate Content
Hi!
You can use second guage and set it transparent
- Mark as New
- Bookmark
- Subscribe
- Mute
- Subscribe to RSS Feed
- Permalink
- Report Inappropriate Content
Thank You for quick response.
Regards,
Varun. K
- Mark as New
- Bookmark
- Subscribe
- Mute
- Subscribe to RSS Feed
- Permalink
- Report Inappropriate Content

- Mark as New
- Bookmark
- Subscribe
- Mute
- Subscribe to RSS Feed
- Permalink
- Report Inappropriate Content
Sergey,
Can you send me the expressions you usedn for reference?
Regards,
Varun
- Mark as New
- Bookmark
- Subscribe
- Mute
- Subscribe to RSS Feed
- Permalink
- Report Inappropriate Content
I used the same expression except I added 0.2 for second guage to see second needle.
sum(fact_qty)/sum(plan_qty)
sum(fact_qty)/sum(plan_qty)+0.2
- Mark as New
- Bookmark
- Subscribe
- Mute
- Subscribe to RSS Feed
- Permalink
- Report Inappropriate Content
How can we make it transparent?
Regards,
Varun
- Mark as New
- Bookmark
- Subscribe
- Mute
- Subscribe to RSS Feed
- Permalink
- Report Inappropriate Content
How can we plot values after making it transparent?
Thanks & Regards,
Varun
- Mark as New
- Bookmark
- Subscribe
- Mute
- Subscribe to RSS Feed
- Permalink
- Report Inappropriate Content
Color -> transparency ->100%
- Mark as New
- Bookmark
- Subscribe
- Mute
- Subscribe to RSS Feed
- Permalink
- Report Inappropriate Content
How can I plot values on top of guage chart?
If I try to plot values on one guage chart, then the size of chart is changing.
Sorry for the trouble and thank you for baring with me
Regards,
Varun
- « Previous Replies
-
- 1
- 2
- Next Replies »