Unlock a world of possibilities! Login now and discover the exclusive benefits awaiting you.
- Qlik Community
- :
- All Forums
- :
- QlikView App Dev
- :
- Re: Cant create following chart
- Subscribe to RSS Feed
- Mark Topic as New
- Mark Topic as Read
- Float this Topic for Current User
- Bookmark
- Subscribe
- Mute
- Printer Friendly Page
- Mark as New
- Bookmark
- Subscribe
- Mute
- Subscribe to RSS Feed
- Permalink
- Report Inappropriate Content
Cant create following chart
Hi All,
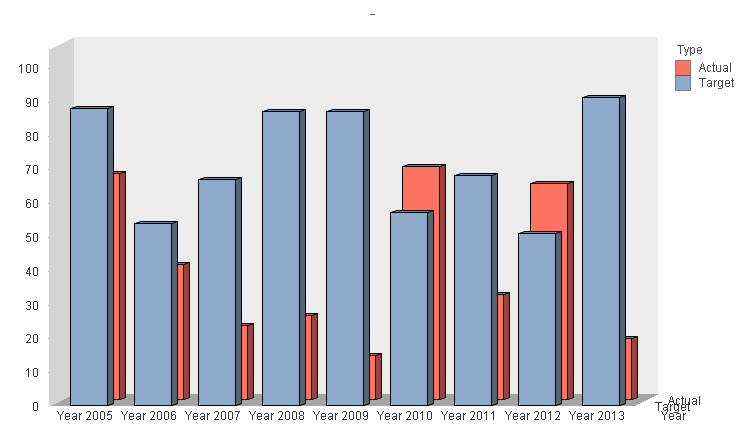
I have following data
| Year | Target | Actual |
| Year 2005 | 88 | 67 |
| Year 2006 | 54 | 40 |
| Year 2007 | 67 | 22 |
| Year 2008 | 87 | 25 |
| Year 2009 | 87 | 13 |
| Year 2010 | 57 | 69 |
| Year 2011 | 68 | 31 |
| Year 2012 | 51 | 64 |
| Year 2013 | 91 | 18 |
I want to show following kind of chart

how to create this kind of chart in Qlikview.
please help me on this.
- Mark as New
- Bookmark
- Subscribe
- Mute
- Subscribe to RSS Feed
- Permalink
- Report Inappropriate Content
Would this work for you?
- Mark as New
- Bookmark
- Subscribe
- Mute
- Subscribe to RSS Feed
- Permalink
- Report Inappropriate Content
Hello, Narendra!
This can be done by two ways:
1. Create two similar charts, make them transparent and lay them on each other;
2. Crete one chart, but with six expressions where each of them will be the 1/6 of the each bar (Year). Some bars will be one colored (blue), some - stacked with two colors (orange + blue).
- Mark as New
- Bookmark
- Subscribe
- Mute
- Subscribe to RSS Feed
- Permalink
- Report Inappropriate Content
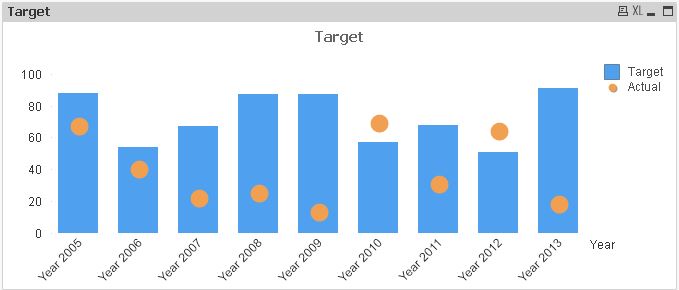
As all suggested, either you create the two Bar chart charts with variable Cluster distance propeties , one on top of other, make top chart transparent.
or you can slightly change the presentation like below
- Mark as New
- Bookmark
- Subscribe
- Mute
- Subscribe to RSS Feed
- Permalink
- Report Inappropriate Content
If you get interested with the second way - please, take a look at the attachement.