Unlock a world of possibilities! Login now and discover the exclusive benefits awaiting you.
- Qlik Community
- :
- All Forums
- :
- QlikView App Dev
- :
- Re: Change Text Format of Values on Data Points
- Subscribe to RSS Feed
- Mark Topic as New
- Mark Topic as Read
- Float this Topic for Current User
- Bookmark
- Subscribe
- Mute
- Printer Friendly Page
- Mark as New
- Bookmark
- Subscribe
- Mute
- Subscribe to RSS Feed
- Permalink
- Report Inappropriate Content
Change Text Format of Values on Data Points
Hi All,
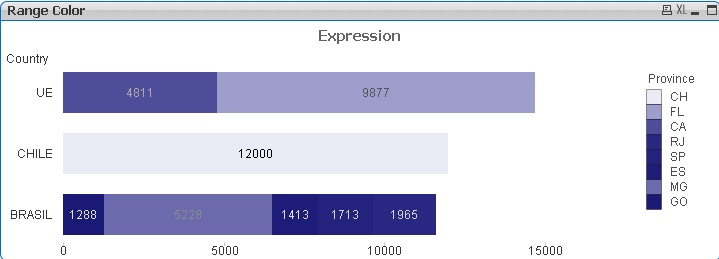
I have a stacked bar chart as per the below, in which there are values on the data points. my issue is that the the black font is difficult to ready against the dark blue bars. If I change the font to white, this then becomes difficult to read against the light blue bars. I am unable to change the colours used for the bars as these colours are required.
Is there any way of changing the text colour for some of the values - e.g. change the values on the last 2 bars to white so that they are easier to read, and leave the rest as black? Or is there an option to outline the values, which may help the colours stand out? Or if anyone has any other solutions, I would be greatful for any help!
I have tried an expression based on an IF statement in Expression -> Text Colour, but this didn't seem to change anything.

Thanks in advance!
Accepted Solutions
- Mark as New
- Bookmark
- Subscribe
- Mute
- Subscribe to RSS Feed
- Permalink
- Report Inappropriate Content
At Expressions tab, expand symbol ![]() your expression.
your expression.
Set an expression to 'font-color' for each dimension value
an example:
if(rowno() > 5, white(), black())
- Mark as New
- Bookmark
- Subscribe
- Mute
- Subscribe to RSS Feed
- Permalink
- Report Inappropriate Content
At Expressions tab, expand symbol ![]() your expression.
your expression.
Set an expression to 'font-color' for each dimension value
an example:
if(rowno() > 5, white(), black())
- Mark as New
- Bookmark
- Subscribe
- Mute
- Subscribe to RSS Feed
- Permalink
- Report Inappropriate Content
Hello Denielle,
here is na example attached.
What I did, was to use to inversed colormix:
1 for the background, going from the light blue to dark blue,
and the inverse to the text ( going from black, to White ).
So, the lighter is the chart, the darker is the text ![]()
Please, see if it is helpfull.
- Mark as New
- Bookmark
- Subscribe
- Mute
- Subscribe to RSS Feed
- Permalink
- Report Inappropriate Content
Very tricky
thanks Lucas
- Mark as New
- Bookmark
- Subscribe
- Mute
- Subscribe to RSS Feed
- Permalink
- Report Inappropriate Content
Thanks Jean-Jacques
Of course, it requires a special treatment to the values to close to the middle ( between 40% and 60% ), because in those cases, the colors get to close ( as showed in the Picture ).
But that can be done with simple conditional ![]() ( if values close, black(), else color expression. )
( if values close, black(), else color expression. )
- Mark as New
- Bookmark
- Subscribe
- Mute
- Subscribe to RSS Feed
- Permalink
- Report Inappropriate Content
Hi Lucas and Anjos,
Thank you both so much for your help!
Both of your answers were really helpful, in the end I went for the rowno solution.
Thanks again!