Unlock a world of possibilities! Login now and discover the exclusive benefits awaiting you.
- Qlik Community
- :
- All Forums
- :
- QlikView App Dev
- :
- Re: Change colors on rows
- Subscribe to RSS Feed
- Mark Topic as New
- Mark Topic as Read
- Float this Topic for Current User
- Bookmark
- Subscribe
- Mute
- Printer Friendly Page
- Mark as New
- Bookmark
- Subscribe
- Mute
- Subscribe to RSS Feed
- Permalink
- Report Inappropriate Content
Change colors on rows
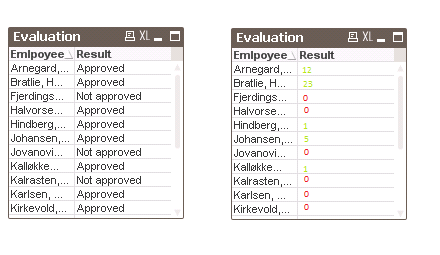
I have made a pivot table to show a list of employees and whether or not they are approved. The value in the data model is actually an integer. If the sum of this value is grater than 0 for a certain employee then he or she is approved. This value is named "Result".
The dimension for the pivot table is the name of the employee.
The expression I have written is: IF(SUM(Result)>0, 'Approved', 'Not approved')
The pivot table show the values as "Approved" or "Not Approved" just as i intended. I would however also like to add colors to the rows. I would like for it to be green if it is approved, and red if it is not approved. Does anyone know how to do this?
I tried getting colors by using the "Visual Cues", but as I have changed the value shown to text messages I did not get it to work. It is however working if I just output the original integer values, by using the expression SUM(RESULT).
Accepted Solutions
- Mark as New
- Bookmark
- Subscribe
- Mute
- Subscribe to RSS Feed
- Permalink
- Report Inappropriate Content
Hi Dagrun
Try using Backgroung Color.
Use Condition:
IF(SUM(Result)>0, RGB(255,0,0),RGB(0,255,0))
Regards
Aviral Nag
- Mark as New
- Bookmark
- Subscribe
- Mute
- Subscribe to RSS Feed
- Permalink
- Report Inappropriate Content
Hi Dagrun
Try using Backgroung Color.
Use Condition:
IF(SUM(Result)>0, RGB(255,0,0),RGB(0,255,0))
Regards
Aviral Nag
- Mark as New
- Bookmark
- Subscribe
- Mute
- Subscribe to RSS Feed
- Permalink
- Report Inappropriate Content
Dear Dagrun,
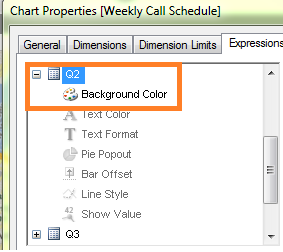
Go into the expression tab, click on + sign for Results and in text add the following syntax:
if(Column(1) = 'Approved', Green(), Red())
For more info please see screen print.
R
- Mark as New
- Bookmark
- Subscribe
- Mute
- Subscribe to RSS Feed
- Permalink
- Report Inappropriate Content
Hi Dagurn,
Please try as told by Aveeeeeee7enits the concept you need to follow.
If you face any issues please let us know.
Regards,
@vi