Unlock a world of possibilities! Login now and discover the exclusive benefits awaiting you.
- Qlik Community
- :
- All Forums
- :
- QlikView App Dev
- :
- Re: Change in colour depending on values
- Subscribe to RSS Feed
- Mark Topic as New
- Mark Topic as Read
- Float this Topic for Current User
- Bookmark
- Subscribe
- Mute
- Printer Friendly Page
- Mark as New
- Bookmark
- Subscribe
- Mute
- Subscribe to RSS Feed
- Permalink
- Report Inappropriate Content
Change in colour depending on values
Hello All,
I have a requirement wherein I need to compare the Failed Count YTD(FCY) column value with 2017 Target value. If the FCY value is greater than the 2017 target, it should be highlighted as green, else red. The table I am using is a straight table. And this comparison should happen across all the products listed.
Any suggestions ?
| Product | 2016 | Failed Count YTD | 2017 Target | 2017 Stretch Target |
| A | 1.10% | 1.8% | 1.00% | 0.80% |
| C | 3.00% | 2.4% | 2.25% | 1.50% |
| D | 5.60% | 2.4% | 4.20% | 2.80% |
| E | 0.00% | 2.4% | 0.00% | 0.00% |
| F | 0.00% | 2.3% | 0.00% | 0.00% |
| G | 0.00% | 2.2% | 0.00% | 0.00% |
| H | 0.30% | 2.1% | 0.23% | 0.15% |
| I | 0.00% | 2.3% | 0.00% | 0.00% |
| J | 0.30% | 1.9% | 0.23% | 0.15% |
Accepted Solutions
- Mark as New
- Bookmark
- Subscribe
- Mute
- Subscribe to RSS Feed
- Permalink
- Report Inappropriate Content
see attach
- Mark as New
- Bookmark
- Subscribe
- Mute
- Subscribe to RSS Feed
- Permalink
- Report Inappropriate Content
Hi,
Expand expression > Background color > write expression for color like
if(FCY_expression > 2017 target,green(),yellow())
regards,
Please appreciate our Qlik community members by giving Kudos for sharing their time for your query. If your query is answered, please mark the topic as resolved 🙂
- Mark as New
- Bookmark
- Subscribe
- Mute
- Subscribe to RSS Feed
- Permalink
- Report Inappropriate Content
In the Backcolor properties try
=if( Sum( TOTAL FCY) > Sum( TOTAL 2017 Target) ,Green(), Red())
- Mark as New
- Bookmark
- Subscribe
- Mute
- Subscribe to RSS Feed
- Permalink
- Report Inappropriate Content
Expand the chart properties of Product dimension from here and then write
=if( Sum( TOTAL FCY) > Sum( TOTAL 2017 Target) ,Green(), Red())
Or
=if( Sum( FCY ) > Sum( 2017 Target) ,Green(), Red())
- Mark as New
- Bookmark
- Subscribe
- Mute
- Subscribe to RSS Feed
- Permalink
- Report Inappropriate Content
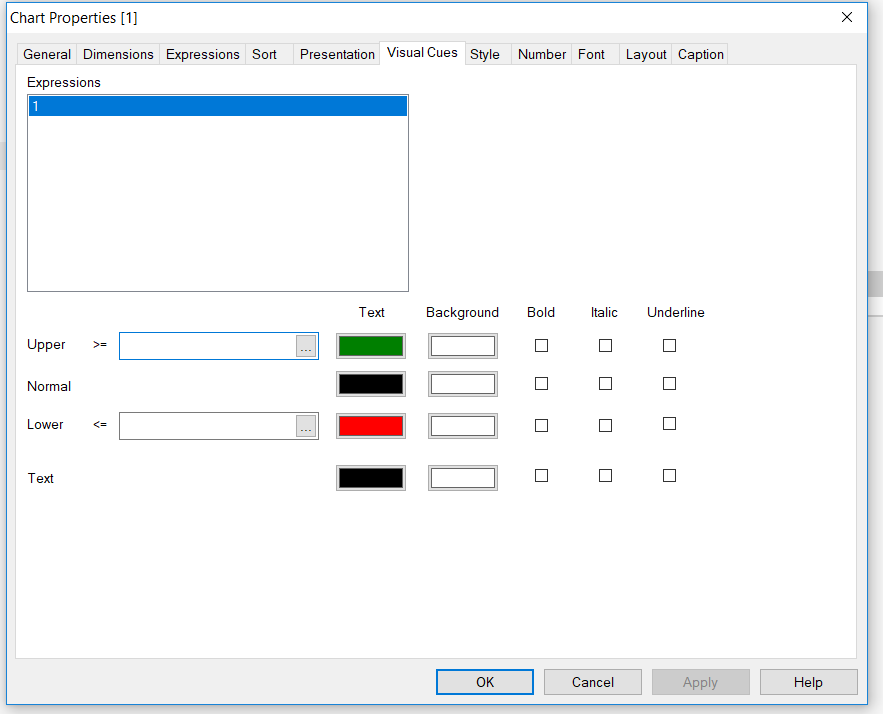
or use visual cues on 2017 Stretch Target
>1 green()

- Mark as New
- Bookmark
- Subscribe
- Mute
- Subscribe to RSS Feed
- Permalink
- Report Inappropriate Content
Joshua,
If you are not using dynamic labels you can use the column labels in your color expression. Something like:
If( [Failed Count YTD] > [2017 Target], LightGreen(), LightRed() )
Good luck
Oscar
- Mark as New
- Bookmark
- Subscribe
- Mute
- Subscribe to RSS Feed
- Permalink
- Report Inappropriate Content
see attach