Unlock a world of possibilities! Login now and discover the exclusive benefits awaiting you.
- Qlik Community
- :
- All Forums
- :
- QlikView App Dev
- :
- Re: Change number format
- Subscribe to RSS Feed
- Mark Topic as New
- Mark Topic as Read
- Float this Topic for Current User
- Bookmark
- Subscribe
- Mute
- Printer Friendly Page
- Mark as New
- Bookmark
- Subscribe
- Mute
- Subscribe to RSS Feed
- Permalink
- Report Inappropriate Content
Change number format
Hi
I have chart which has by default % format which has to change to number format once I click on button.
Thanks
- Mark as New
- Bookmark
- Subscribe
- Mute
- Subscribe to RSS Feed
- Permalink
- Report Inappropriate Content
You can do like this.
-Create a text box and a variable FL_format. In properties Action/Action/Set variable with =if(FL_format=1,0,1).
-In your expression : =num(sum(Express1)/ sum(total Express1),if((FL_format=1),'# ##0,00%','# ##0,00'))

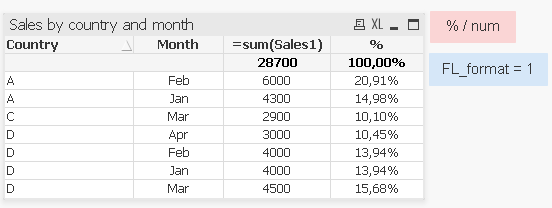
Is this what you're trying to achieve?
- Mark as New
- Bookmark
- Subscribe
- Mute
- Subscribe to RSS Feed
- Permalink
- Report Inappropriate Content
You may need one variable with Set Value from expression Orient
- Mark as New
- Bookmark
- Subscribe
- Mute
- Subscribe to RSS Feed
- Permalink
- Report Inappropriate Content
All above are correct!
the other option you have is to create one column with % and one column with numeric format and then use variable and button to conditionally hide/show columns
i like this option more then formatting numbers using num function as it slightly changes values behaviour when exporting table to excel
regards
Lech
- Mark as New
- Bookmark
- Subscribe
- Mute
- Subscribe to RSS Feed
- Permalink
- Report Inappropriate Content
hi,
I have created drill down group in chart & used Sum(pop)/100 as expression.

When I click on chart for Country or State it should calculated Sum(pop)/100. but when I click on City it should show only Sum(pop). This is the actual problem.
- Mark as New
- Bookmark
- Subscribe
- Mute
- Subscribe to RSS Feed
- Permalink
- Report Inappropriate Content
May be change your expression
If(GetFieldSelections(Country) >0 or GetFieldSelections(State) >0, Sum(pop)/100, Sum(pop))
Or
If(GetFieldSelections(Country) >0 or GetFieldSelections(State) >0, Sum(pop)/100, If(GetFieldSelection(City)>0,Sum(pop)))