Unlock a world of possibilities! Login now and discover the exclusive benefits awaiting you.
- Qlik Community
- :
- All Forums
- :
- QlikView App Dev
- :
- Re: Change the dimenson from bottom to the top
- Subscribe to RSS Feed
- Mark Topic as New
- Mark Topic as Read
- Float this Topic for Current User
- Bookmark
- Subscribe
- Mute
- Printer Friendly Page
- Mark as New
- Bookmark
- Subscribe
- Mute
- Subscribe to RSS Feed
- Permalink
- Report Inappropriate Content
Change the dimenson from bottom to the top
Hi,
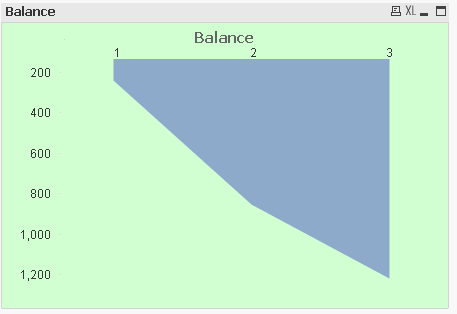
In general we create a line chart and the x-Axes is on the bottom. How could I change that to the top? Just as the following picture: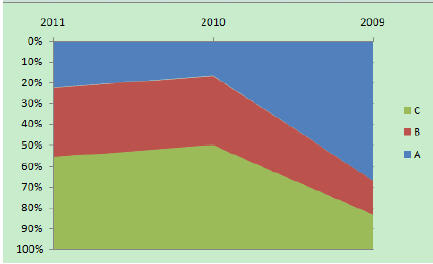
Thanks so much!
- Mark as New
- Bookmark
- Subscribe
- Mute
- Subscribe to RSS Feed
- Permalink
- Report Inappropriate Content
May be like attached sample?
- Mark as New
- Bookmark
- Subscribe
- Mute
- Subscribe to RSS Feed
- Permalink
- Report Inappropriate Content
Thanks!
What I would like to get is that add the 'year' dimension on the top..such as that 2011,2010,2009...
- Mark as New
- Bookmark
- Subscribe
- Mute
- Subscribe to RSS Feed
- Permalink
- Report Inappropriate Content
I am afraid that you can't do that directly in the same chart (would like to see somebody proves me wrong). As a work around, you can create another chart with similar dimension and customize it's appearance(Ctrl+Shift) and place the dimension part at your desired position.
- Mark as New
- Bookmark
- Subscribe
- Mute
- Subscribe to RSS Feed
- Permalink
- Report Inappropriate Content
I found some workaround 
Look into attached example.
I dont know if..., and how...., but maybe extension is some better idea???
regards
Darek
- Mark as New
- Bookmark
- Subscribe
- Mute
- Subscribe to RSS Feed
- Permalink
- Report Inappropriate Content
Hi Dariusz,
Good one! I have tweaked your sample a bit to get what was required like.
- Mark as New
- Bookmark
- Subscribe
- Mute
- Subscribe to RSS Feed
- Permalink
- Report Inappropriate Content
Tresesco, Have you converted the chart as a line chart and select the style as mentioned (pls refer the chart image) by Jelly Chen in this question. It looks like it is not working in the line chart > style as area. works in a combo chart
- Mark as New
- Bookmark
- Subscribe
- Mute
- Subscribe to RSS Feed
- Permalink
- Report Inappropriate Content
I cloned the same chart and kept it on top of the regular one and then just showing the dimension in the top chart brought a chart look similar to the chart image posted in the question. But this solution requires two chart and may not be advisable.