Unlock a world of possibilities! Login now and discover the exclusive benefits awaiting you.
- Qlik Community
- :
- All Forums
- :
- QlikView App Dev
- :
- Changing color for each value in a dimension
- Subscribe to RSS Feed
- Mark Topic as New
- Mark Topic as Read
- Float this Topic for Current User
- Bookmark
- Subscribe
- Mute
- Printer Friendly Page
- Mark as New
- Bookmark
- Subscribe
- Mute
- Subscribe to RSS Feed
- Permalink
- Report Inappropriate Content
Changing color for each value in a dimension
Hello everyone,
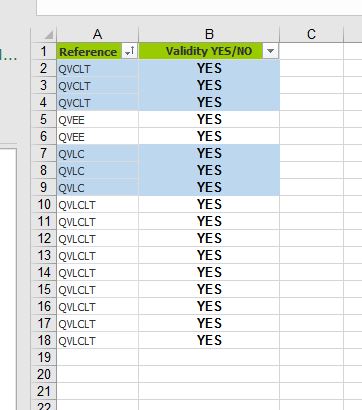
I have to color a simple table with two colors. Every time that a value in a dimension change the color must be changed
like this:
 ,
,
Does someone have an idea?
Thank you in advance,
- Mark as New
- Bookmark
- Subscribe
- Mute
- Subscribe to RSS Feed
- Permalink
- Report Inappropriate Content
Have a look here: Colors in charts
- Marcus
- Mark as New
- Bookmark
- Subscribe
- Mute
- Subscribe to RSS Feed
- Permalink
- Report Inappropriate Content
You could try something like this for the background color expression for the dimensions and expressions:
if(aggr(NODISTINCT Mod(RowNo(),2),Reference)>0,color(1),color(2))
talk is cheap, supply exceeds demand
- Mark as New
- Bookmark
- Subscribe
- Mute
- Subscribe to RSS Feed
- Permalink
- Report Inappropriate Content
Hi thank you for your answer but it seems like the aggr is not well calculated with big selection. When I have a selection of hundreds references I have some errors like bellow
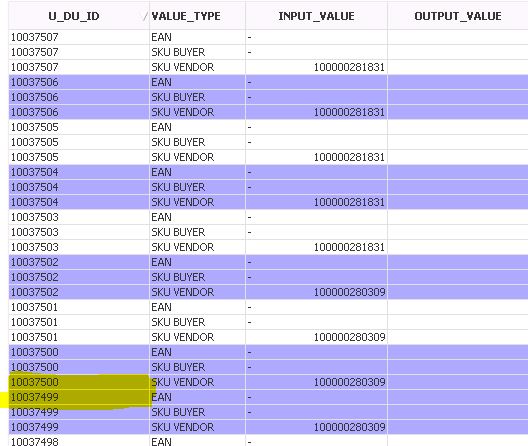
if I select few references, it's working well:
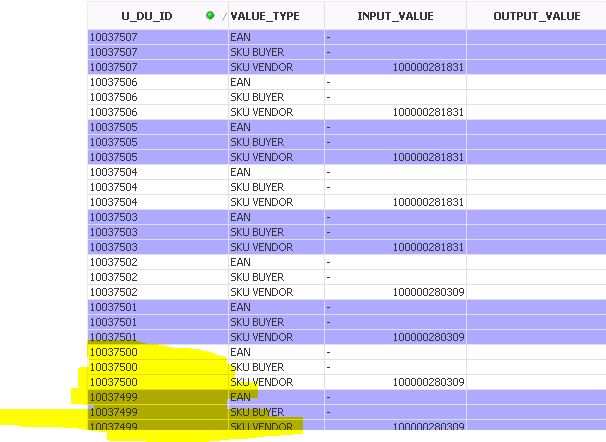
The formula for the color is : =if(aggr(NODISTINCT Mod(RowNo(),2),U_DU_ID)>0,rgb(168,168,255),white())
Do you have an idea on this?
Thanks a lot,
- Mark as New
- Bookmark
- Subscribe
- Mute
- Subscribe to RSS Feed
- Permalink
- Report Inappropriate Content
The aggr function sorts by load order. Your table is sorted numerically descending. It's possible that this causes the mismatches. You could try to create a temporary table in the script that loads the U_DU_ID values in numerical order. create that table before you load the 'real' data. That way the aggr function will use that ordering.
talk is cheap, supply exceeds demand
- Mark as New
- Bookmark
- Subscribe
- Mute
- Subscribe to RSS Feed
- Permalink
- Report Inappropriate Content
With the newest releases it would be possible to sort an aggr: The sortable Aggr function is finally here!
- Marcus