Unlock a world of possibilities! Login now and discover the exclusive benefits awaiting you.
- Qlik Community
- :
- All Forums
- :
- QlikView App Dev
- :
- Changing fields for formulas with selection outsid...
- Subscribe to RSS Feed
- Mark Topic as New
- Mark Topic as Read
- Float this Topic for Current User
- Bookmark
- Subscribe
- Mute
- Printer Friendly Page
- Mark as New
- Bookmark
- Subscribe
- Mute
- Subscribe to RSS Feed
- Permalink
- Report Inappropriate Content
Changing fields for formulas with selection outside the formula itself
Hi, I would like to define a visuasilation based on changing fields, i.e. I have five fields and want to be able to select them by a filter? drop-down list? and then the field should be the basis for a formula. Can anybody tell me how to do this? Thanks, Daniela
- Mark as New
- Bookmark
- Subscribe
- Mute
- Subscribe to RSS Feed
- Permalink
- Report Inappropriate Content
If you're using Qlikview you can create a Cyclic group that contains the five fields. You can use the group as dimension in the chart.
Or you can use create small extra table in the script that contains the field names:
FieldsForSelection:
LOAD * INLINE [
FieldName
Store
Product
Brand
Customer
Salesperson
];
Add a listbox for the FieldsForSelection field. Select one value and then enable the Always One Selected Value option in the properties of the listbox.
You can then use a calculated dimension like =$('[' & Only(FieldName) & ']') as dimension in the chart.
talk is cheap, supply exceeds demand
- Mark as New
- Bookmark
- Subscribe
- Mute
- Subscribe to RSS Feed
- Permalink
- Report Inappropriate Content
Hi,
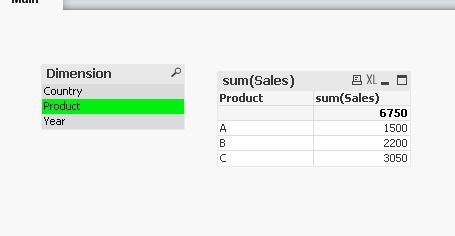
Refer to the attached sample,
Dimension:
=$(=only(Dimension))
Measure:
sum(Sales)
fyi, below is back end script
Fact:
Load * Inline [
Year,Country,Product,Sales
2015,India,A,1500
2016,India,B,2200
2017,India,C,3050
2015,Singapore,1950
2016,Singapore,2060
2017,Singapore,3500
];
Dimensionlist:
Load * Inline [
Dimension
Year
Country
Product
];
- Mark as New
- Bookmark
- Subscribe
- Mute
- Subscribe to RSS Feed
- Permalink
- Report Inappropriate Content
Dear Gysbert,
thanks a lot and sorry for the delay in answering. QlikSense is more of a hobby... I will try to implement, even though my trial gave me an Syntax error regarding "LOAD * INLINE [". It might be the language.
BR,
Daniela
- Mark as New
- Bookmark
- Subscribe
- Mute
- Subscribe to RSS Feed
- Permalink
- Report Inappropriate Content
Hi,
thanks a lot. I will try to implement it tonight (QlikSense is more of a Hobby)
BR,
Daniela