Unlock a world of possibilities! Login now and discover the exclusive benefits awaiting you.
- Qlik Community
- :
- All Forums
- :
- QlikView App Dev
- :
- Re: Chart Display (Combined Charts)
- Subscribe to RSS Feed
- Mark Topic as New
- Mark Topic as Read
- Float this Topic for Current User
- Bookmark
- Subscribe
- Mute
- Printer Friendly Page
- Mark as New
- Bookmark
- Subscribe
- Mute
- Subscribe to RSS Feed
- Permalink
- Report Inappropriate Content
Chart Display (Combined Charts)
Guys, appreciate your feedback below.
I am using QlikView. I wanted to display % of order on Food A vs number of Chinese customer who ordered Food A in the month of June in the same chart. I have the excel ready which looked like this. I wanted to display % of order on Food A as Line and number of Chinese customer ordered Food A in Bar in the same chart.
Now, I am only able to display either one of them in a chart but I could not combine both into 1 single chart. Please help!
How should I put the expression for number of Chinese customer? I only know to sum(Food A) and change the display to relative. But the relative doesn't make any sense also as it only display % of each month for eg. I chosen June to August to display, the % is the total from June to August. Instead, I wanted it to display % of Food A order on total of Chinese customer in June (LINE) vs number of total Chinese customer in June (BAR).
| Month | Ethnic | Customer | Food A | Food B |
| June | Chinese | A | 1 | 2 |
| June | Chinese | A | 2 | 2 |
| June | Malay | B | 2 | 3 |
Thanks!
- Mark as New
- Bookmark
- Subscribe
- Mute
- Subscribe to RSS Feed
- Permalink
- Report Inappropriate Content
You can use below expression for Chinese customer
sum({<Ethnic={'Chinese'}>}Food A)
- Mark as New
- Bookmark
- Subscribe
- Mute
- Subscribe to RSS Feed
- Permalink
- Report Inappropriate Content
Hi,
like this?
sum({<Ethnic={'Chinese'}>}[Food A])
sum({<Ethnic={'Chinese'}>}[Food A])/sum(Total [Food A])
- Mark as New
- Bookmark
- Subscribe
- Mute
- Subscribe to RSS Feed
- Permalink
- Report Inappropriate Content
Guys,
Thanks for your input but it is close to what I am looking to do. Let me use another example:
| MONTH | CNTITEM | CNTLINE | IDITEM | QTYINVC | IDCUST | ENQUIRY REPORT | INDUSTRY | QUARTER | ESTABLISHMENT | CUSTOMER NAME |
| Apr-16 | 4049 | 5 | E22 | 3 | 7800 | Yes | Finance and Insurance | Q2'16 | SME | A |
| Apr-16 | 4049 | 7 | M003 | 192 | 7800 | Yes | Finance and Insurance | Q2'16 | SME | A |
| May-16 | 3923 | 6 | M003 | 192 | 7800 | Yes | Finance and Insurance | Q2'16 | SME | A |
| May-16 | 3923 | 6 | M003 | 192 | 7800 | Yes | Finance and Insurance | Q2'16 | SME | A |
| Jun-16 | 3882 | 5 | E22 | 2 | 7800 | Yes | Finance and Insurance | Q2'16 | SME | A |
| Jun-16 | 3882 | 7 | M003 | 193 | 7800 | Yes | Finance and Insurance | Q2'16 | SME | A |
| Apr-16 | 783 | 5 | M003 | 508 | 8800 | Yes | Finance and Insurance | Q2'16 | SME | B |
| May-16 | 776 | 5 | M003 | 509 | 8800 | Yes | Finance and Insurance | Q2'16 | SME | B |
| Jun-16 | 758 | 5 | M003 | 509 | 8800 | Yes | Finance and Insurance | Q2'16 | SME | B |
| Apr-16 | 3187 | 5 | E22 | 20 | 3300 | Yes | Finance and Insurance | Q2'16 | SME | C |
| Apr-16 | 3187 | 7 | M75 | 264 | 3300 | Yes | Finance and Insurance | Q2'16 | SME | C |
| May-16 | 3084 | 5 | E22 | 14 | 3300 | Yes | Finance and Insurance | Q2'16 | SME | C |
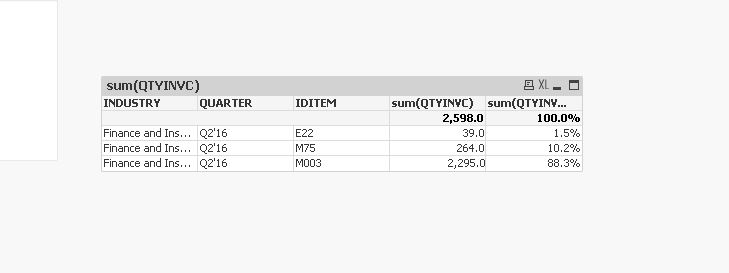
How can I derive total of whole Finance and Insurance industry for Q2'16 in "QTYINVC"? I need the Quarter be able to display accordingly to each and every quarter as there are 5 quarters in total. It has to show total of the industry in every quarter by QTYINVC.
Thanks!
- Mark as New
- Bookmark
- Subscribe
- Mute
- Subscribe to RSS Feed
- Permalink
- Report Inappropriate Content
Hi,
What is the expected here?,
- Mark as New
- Bookmark
- Subscribe
- Mute
- Subscribe to RSS Feed
- Permalink
- Report Inappropriate Content
Hi Devarasu,
Thanks for the reply. I am looking to have a comparison between QTYINVC by company (in % & Quarter) vs total quarter of QTYINVC for the same industry in each quarter (determined by the company searched for). Need to display this in a single chart.
There's another chart I need to display which is percentage of growth by quarter (by QTYINVC) for a company, industry (same with company's industry) and banks which I have separated under establishment.
Please help advise if this is possible.
Thanks!
- Mark as New
- Bookmark
- Subscribe
- Mute
- Subscribe to RSS Feed
- Permalink
- Report Inappropriate Content
can you tell us expected output with logic?
- Mark as New
- Bookmark
- Subscribe
- Mute
- Subscribe to RSS Feed
- Permalink
- Report Inappropriate Content
Hi Wei, I think you are asking about the TOTAL qualifier:
sum(Food A)/sum(TOTAL <Month, Ethnic> Food A)
- Mark as New
- Bookmark
- Subscribe
- Mute
- Subscribe to RSS Feed
- Permalink
- Report Inappropriate Content
Hi Kushal,
Problem is I do not know how to set the logic. I have set the Dimensions to Quarter. Let say company A is the variables that I can choose everytime. Hence, for the QTYINVC by company (in % & Quarter), I have set as below:
sum(QTYINVC)
Problem is when I use relative it is the total % among 5 quarters (what I'm having now) combined together instead of total QTYINVC of company A over its total QTYINVC of company A's industry in each quarter.
For second bar how do I display total QTYINVC of the industry of company A in every quarter?
- Mark as New
- Bookmark
- Subscribe
- Mute
- Subscribe to RSS Feed
- Permalink
- Report Inappropriate Content
Hi Ruben,
Thanks for the reply. It is almost there but what I'm actually looking for is actually what I've replied to Devarasu and Kushal above.
Thanks!