Unlock a world of possibilities! Login now and discover the exclusive benefits awaiting you.
- Qlik Community
- :
- All Forums
- :
- QlikView App Dev
- :
- Chart Sum Values Help
- Subscribe to RSS Feed
- Mark Topic as New
- Mark Topic as Read
- Float this Topic for Current User
- Bookmark
- Subscribe
- Mute
- Printer Friendly Page
- Mark as New
- Bookmark
- Subscribe
- Mute
- Subscribe to RSS Feed
- Permalink
- Report Inappropriate Content
Chart Sum Values Help
Hello All,
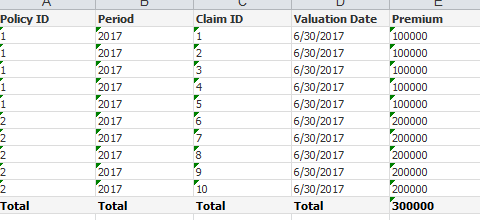
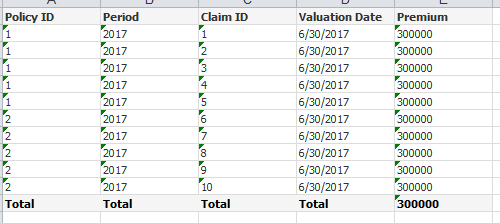
I hope this is an easy question, I will try to explain as best as possible.I have a chart, sample attached, which has two policy ID's within the same date period. What I want is for all the Claim ID's to show the same value, which is the sum of the two premium values.Policy 1 has Premium = 100000 and Policy 2 has Premium = 200000. I want to do this in the chart expression.
Basically I have this:
What I want is this:
Any help is appreciated.
Accepted Solutions
- Mark as New
- Bookmark
- Subscribe
- Mute
- Subscribe to RSS Feed
- Permalink
- Report Inappropriate Content
- Mark as New
- Bookmark
- Subscribe
- Mute
- Subscribe to RSS Feed
- Permalink
- Report Inappropriate Content
May be this:
= Sum(TOTAL [Premium])
- Mark as New
- Bookmark
- Subscribe
- Mute
- Subscribe to RSS Feed
- Permalink
- Report Inappropriate Content
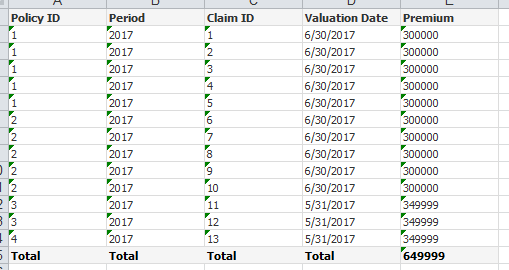
Thanks for the quick reply. I probably should have included a larger sampling. The issue I have with Total is that if there are additional policy ID's for other dates then using Sum(TOTAL [Premium]) will show that value on all rows (Policy 3, Period 2017, Valuation Date 5/31/2017, premium 150000)?. I need to limit to the particular Period & Valuation Date
- Mark as New
- Bookmark
- Subscribe
- Mute
- Subscribe to RSS Feed
- Permalink
- Report Inappropriate Content
Can you add some sample or update your qvw and give me your expected output?
- Mark as New
- Bookmark
- Subscribe
- Mute
- Subscribe to RSS Feed
- Permalink
- Report Inappropriate Content
I updated the qvw. Here is what I want:
- Mark as New
- Bookmark
- Subscribe
- Mute
- Subscribe to RSS Feed
- Permalink
- Report Inappropriate Content
use this:
= Sum(Total <[Valuation Date] > [Premium])
- Mark as New
- Bookmark
- Subscribe
- Mute
- Subscribe to RSS Feed
- Permalink
- Report Inappropriate Content
Thanks. That works. So that acts as group by essentially. Thanks for the help.
- Mark as New
- Bookmark
- Subscribe
- Mute
- Subscribe to RSS Feed
- Permalink
- Report Inappropriate Content
Yes.