Unlock a world of possibilities! Login now and discover the exclusive benefits awaiting you.
- Qlik Community
- :
- All Forums
- :
- QlikView App Dev
- :
- Re: Chart for comparing the 2 measures with 1 dime...
- Subscribe to RSS Feed
- Mark Topic as New
- Mark Topic as Read
- Float this Topic for Current User
- Bookmark
- Subscribe
- Mute
- Printer Friendly Page
- Mark as New
- Bookmark
- Subscribe
- Mute
- Subscribe to RSS Feed
- Permalink
- Report Inappropriate Content
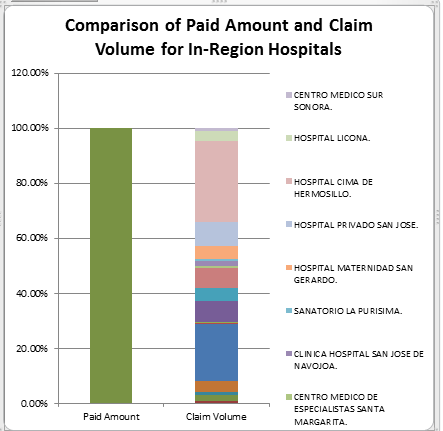
Chart for comparing the 2 measures with 1 dimesion
Hi All,
I need to create chart as shown below. I am not able to create the same. Chart is been created in Excel I wanted to create the same in Qlikview
Accepted Solutions
- Mark as New
- Bookmark
- Subscribe
- Mute
- Subscribe to RSS Feed
- Permalink
- Report Inappropriate Content
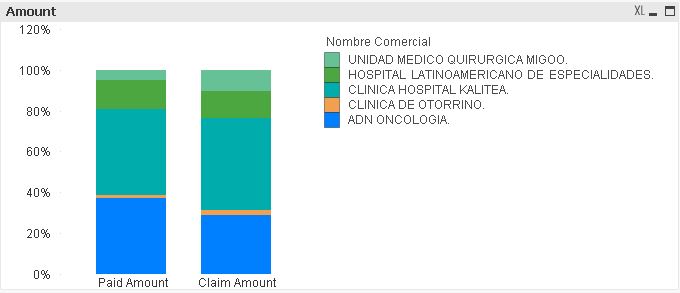
Create Bar chart
Dimension:
1) ValueList('Paid Amount','Claim Amount')
2) [Nombre Comercial]
Expression:
=pick(match(ValueList('Paid Amount','Claim Amount'),'Paid Amount','Claim Amount'),
sum([Control Period Paid Amount])/sum(TOTAL [Control Period Paid Amount]),
sum([Control period Claim Volume])/sum(TOTAL [Control period Claim Volume]))
- Mark as New
- Bookmark
- Subscribe
- Mute
- Subscribe to RSS Feed
- Permalink
- Report Inappropriate Content
Please share the sample data
- Mark as New
- Bookmark
- Subscribe
- Mute
- Subscribe to RSS Feed
- Permalink
- Report Inappropriate Content
Hi,
Please find the sample Data.
here Nombre Commercial[Hospital Name] as Dimension and Paid Amount and Claim Volume as Measure.
- Mark as New
- Bookmark
- Subscribe
- Mute
- Subscribe to RSS Feed
- Permalink
- Report Inappropriate Content
Create Bar chart
Dimension:
1) ValueList('Paid Amount','Claim Amount')
2) [Nombre Comercial]
Expression:
=pick(match(ValueList('Paid Amount','Claim Amount'),'Paid Amount','Claim Amount'),
sum([Control Period Paid Amount])/sum(TOTAL [Control Period Paid Amount]),
sum([Control period Claim Volume])/sum(TOTAL [Control period Claim Volume]))
- Mark as New
- Bookmark
- Subscribe
- Mute
- Subscribe to RSS Feed
- Permalink
- Report Inappropriate Content
Thank u so much !!!!
Really appreciate ur quick response. 
- Mark as New
- Bookmark
- Subscribe
- Mute
- Subscribe to RSS Feed
- Permalink
- Report Inappropriate Content
No problem