Unlock a world of possibilities! Login now and discover the exclusive benefits awaiting you.
- Qlik Community
- :
- All Forums
- :
- QlikView App Dev
- :
- Chart functionality
- Subscribe to RSS Feed
- Mark Topic as New
- Mark Topic as Read
- Float this Topic for Current User
- Bookmark
- Subscribe
- Mute
- Printer Friendly Page
- Mark as New
- Bookmark
- Subscribe
- Mute
- Subscribe to RSS Feed
- Permalink
- Report Inappropriate Content
Chart functionality
Hi All,
I have a query. I have column chart. When I select one of the element of it (Ex. Y axis has month Jan to Dec). When I select one of the month, rest months get invisible. only one month bar column shows. do we have option that if we select any bar , rest should be visible but in deactivated format. As in filter we select any value unavailable shows in Grey background.
Thanks in advance.
- « Previous Replies
- Next Replies »
- Mark as New
- Bookmark
- Subscribe
- Mute
- Subscribe to RSS Feed
- Permalink
- Report Inappropriate Content
Hi Narendra ,
set the below expression to background color ,
if(isnull(only([Field name])) ,ARGB(20,200,200,200),ARGB(190,43, 123, 70)).
Regards,
Murali Mohan.T
- Mark as New
- Bookmark
- Subscribe
- Mute
- Subscribe to RSS Feed
- Permalink
- Report Inappropriate Content
Hi All,
I think I am unable to explain correctly. Please find following images.
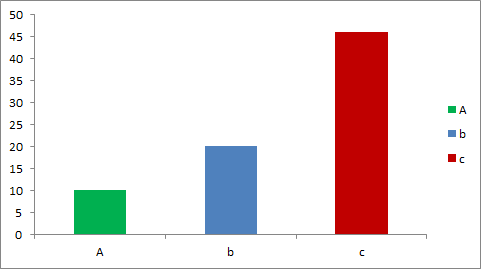
* This is my Qlikview chart.
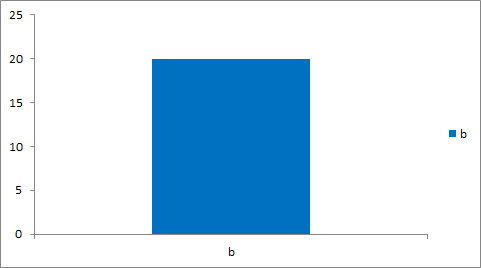
* When I click on "b" column bar. It look like this.
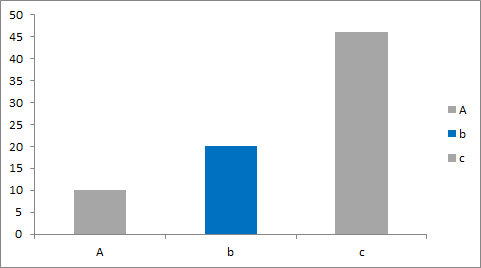
* I want chart like this.
Please help on this.
- Mark as New
- Bookmark
- Subscribe
- Mute
- Subscribe to RSS Feed
- Permalink
- Report Inappropriate Content
You have to:
- Modify the expression so it is not affected by the month selection. Add/modify Month= to a set expression.
- Create a conditional background colour expression for the bars. Something like:
=If(WildMatch(GetFieldSelections(Month), Month), RGB(180, 180, 180))
This assumes the chart dimension is a field named "Month". Adapt this to your specific requirements.
If you need more specific help, you will need to provide more details, such as the dimension and expression of the chart, or better still, a small qvw containing sample data and the chart you would like to modify.
- Mark as New
- Bookmark
- Subscribe
- Mute
- Subscribe to RSS Feed
- Permalink
- Report Inappropriate Content
hi, I tried it. but does not work. showing same result.
- Mark as New
- Bookmark
- Subscribe
- Mute
- Subscribe to RSS Feed
- Permalink
- Report Inappropriate Content
I have considered that your bar chart is having below
Dimension
InvoiceMonth
Expression
SUM(Sales)
To achieve your requirements..
Use Expression as below
SUM({<InvoiceMonth>}Sales)
Use below as Expression background color..
IF(GetSelectedCount(InvoiceMonth)<>0,
IF(InvoiceMonth = GetFieldSelections(InvoiceMonth),Green(),LightGray()))
If you want to show multi color when no month is selected, go to colors tab and Tick Multicolored.
Note : Change your field name and expression accordingly.
Hope this is what you are looking for..
- Mark as New
- Bookmark
- Subscribe
- Mute
- Subscribe to RSS Feed
- Permalink
- Report Inappropriate Content
If you want multiple months selection and want to show all of them as green.. use as below
IF(GetSelectedCount(InvoiceMonth)<>0,
IF(SubStringCount(GetFieldSelections(InvoiceMonth),InvoiceMonth),Green(),LightGray()))
- Mark as New
- Bookmark
- Subscribe
- Mute
- Subscribe to RSS Feed
- Permalink
- Report Inappropriate Content
Hi All,
Please read question again.
I think I am unable to explain correctly. Please find following images.
* This is my Qlikview chart.

* When I click on "b" column bar. It look like this.

* I want chart like this.

Please help on this.
- Mark as New
- Bookmark
- Subscribe
- Mute
- Subscribe to RSS Feed
- Permalink
- Report Inappropriate Content
Try like this : Right Click on chart > Select Set Reference that should work in your case
- Mark as New
- Bookmark
- Subscribe
- Mute
- Subscribe to RSS Feed
- Permalink
- Report Inappropriate Content
Try like this : Right Click on chart > Select Set Reference that should work in your case
- « Previous Replies
- Next Replies »