Unlock a world of possibilities! Login now and discover the exclusive benefits awaiting you.
- Qlik Community
- :
- All Forums
- :
- QlikView App Dev
- :
- Chart on the basis of a customer ID displayed in a...
- Subscribe to RSS Feed
- Mark Topic as New
- Mark Topic as Read
- Float this Topic for Current User
- Bookmark
- Subscribe
- Mute
- Printer Friendly Page
- Mark as New
- Bookmark
- Subscribe
- Mute
- Subscribe to RSS Feed
- Permalink
- Report Inappropriate Content
Chart on the basis of a customer ID displayed in a dynamic straight table
Dear Qlikviewfriends,
I would like to display the sales trend/results of our top customers in a line chart on the basis of a customer ID displayed in a dynamic straight table (customer ID, name,sales YTD, etc.) The chart should display only the sales trend of the first customer (ID number in table line 01). With an action button <next> I would like to display the next customer (ID number in table line 02). In reverse, with an action button <previous> I would like to display the results of the previous customer. At the end the buttons enables me to navigate through the dynamic list of customers.
How to setup the chart expression definition and how to setup the <next> &<previous> button instruction.??
Your help is highly appreciated.
Regards,Ronald.
Accepted Solutions
- Mark as New
- Bookmark
- Subscribe
- Mute
- Subscribe to RSS Feed
- Permalink
- Report Inappropriate Content
Ronald,
I was a bit busy at work today, hence couldnt respond. I used your expressions and created a two text boxes with expressions needed.
RED: List of selected customerID
Green: Expression to use in bar/linechart. It seems to work of me.
Ofcourse, since I dont have Year field I just ignored that in set analysis. If you can share your application, I am happy to debug.
Let me know if I am missing anything.
Kiran.
- Mark as New
- Bookmark
- Subscribe
- Mute
- Subscribe to RSS Feed
- Permalink
- Report Inappropriate Content
Hi Ronald,
This is how I would do it:
Create a variable vRank and by default assign 1. Create a straight table with a calculated dimension customer as if(aggr(rank(sum({1} [sales YTD])),[customer ID])=vRank,[customer ID]), and expression sales as sum(sales ytd).
So by default the table would show only one record (top customer). Create the line chart as needed and add the same calculated dimension to it. So the chart shows trend for the top customer.
Create to button previous and add action, External->Set Variable, Variable vRank to vRank +1 and viceversa. This changes the rank you need to see. You can add some conditional to aviod navigation beyond extremes.
I am not sure if explained correctly so attaching a sample for demonstration. Hope this answers your query.
Kiran.
- Mark as New
- Bookmark
- Subscribe
- Mute
- Subscribe to RSS Feed
- Permalink
- Report Inappropriate Content
Hi Kiran,
Many thanks for your swift reply. The expression and button actions works fine for tables. So well done my friend!
Nevertheless I am still struggling with the chart. I would like to create a bar/line chart to display the monthly sales for a certain year and a specific customer ( rank 1,2,3,4, etc). My challenge is to solve the expression, could you please advice?
To build a fixed chart I couldus the expression :
=
sum({$<
Customer ID={180035}>}
Sales)
To determine the correct Customer ID (180035) I simply reuse your expression, ending up with this expression:
=
sum({$<
Customer ID={
$(=if(aggr(rank(sum(aggr(rank(sum({$<Year={$(=Only(Year))}>}Sales)),[ Customer ID
]))),[ Customer ID
])=vRank,[ Customer ID
]))}>}
Sales)
Somehow the chart box returns with the message "No data to display."
Any idea how to solve this?
Regards, Ronald
- Mark as New
- Bookmark
- Subscribe
- Mute
- Subscribe to RSS Feed
- Permalink
- Report Inappropriate Content
This would work if only one Year is selected. Can yo confirm the result for
=concat(if(aggr(rank(sum(aggr(rank(sum({$<Year={$(=Only(Year))}>}Sales)),[ Customer ID
]))),[ Customer ID
])=vRank,[ Customer ID
]))
Thru a text box?
Kiran.
- Mark as New
- Bookmark
- Subscribe
- Mute
- Subscribe to RSS Feed
- Permalink
- Report Inappropriate Content
Hi Kiran,
The text box remains empty....
Let's review the table I constructed to test te expressions (the reset buton reset vRank to 1)
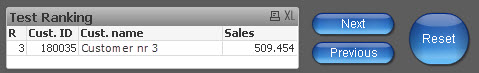
Column 1:
=sum(aggr(rank(sum({$<Year={$(=Only(year))}>}Sales)),[Customer ID]))
Column 2:
=if(aggr(rank(sum({$<Year={$(=Only(Year))}>}Sales)),[Customer ID])=vRank,[Customer ID])
Column 3:
=if(aggr(rank(sum({$<Year={$(=Only(Year))}>}Sales)),[Customer ID])=vRank,[Customer name])
Column 4:
Sum (Sales)
With the above in mind I thought it would be easy to use the expression as used in column 2 for the selection of the wanted Customer ID in my bar/line chart...
Regards Ronald
- Mark as New
- Bookmark
- Subscribe
- Mute
- Subscribe to RSS Feed
- Permalink
- Report Inappropriate Content
Ronald,
I was a bit busy at work today, hence couldnt respond. I used your expressions and created a two text boxes with expressions needed.
RED: List of selected customerID
Green: Expression to use in bar/linechart. It seems to work of me.
Ofcourse, since I dont have Year field I just ignored that in set analysis. If you can share your application, I am happy to debug.
Let me know if I am missing anything.
Kiran.
- Mark as New
- Bookmark
- Subscribe
- Mute
- Subscribe to RSS Feed
- Permalink
- Report Inappropriate Content
Kiran,
Please do not apologize; your help is highly appreciated!!
I have used your expressions in the chart and it works exactly as intended. See expression and screen image.
=sum({$<Customer ID={$(=concat(if(aggr(rank(sum([Sales])),[Customer ID])=vRank,[Customer ID]),','))}>}Sales)
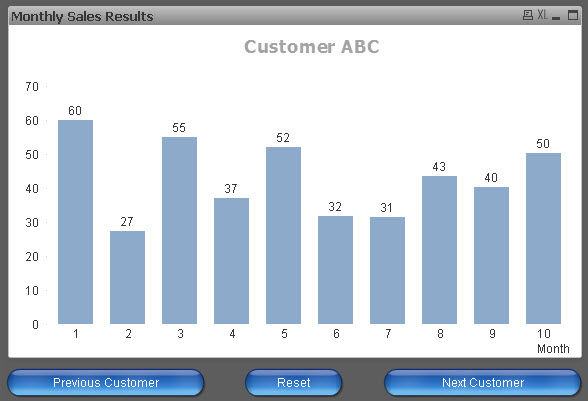
Many thanks for your excellent support.
Regards,
Ronald.