Unlock a world of possibilities! Login now and discover the exclusive benefits awaiting you.
- Qlik Community
- :
- All Forums
- :
- QlikView App Dev
- :
- Chart show Values for only one segment on top of d...
- Subscribe to RSS Feed
- Mark Topic as New
- Mark Topic as Read
- Float this Topic for Current User
- Bookmark
- Subscribe
- Mute
- Printer Friendly Page
- Mark as New
- Bookmark
- Subscribe
- Mute
- Subscribe to RSS Feed
- Permalink
- Report Inappropriate Content
Chart show Values for only one segment on top of data points
Dear friends and community members,
I am concating values / results from two aggr. functions and trying to display customized result (in a specific format) on top of bar as values on data points but it is showing values for only one segment (largest segment) rather than showing the consolidated sum of all the segment.
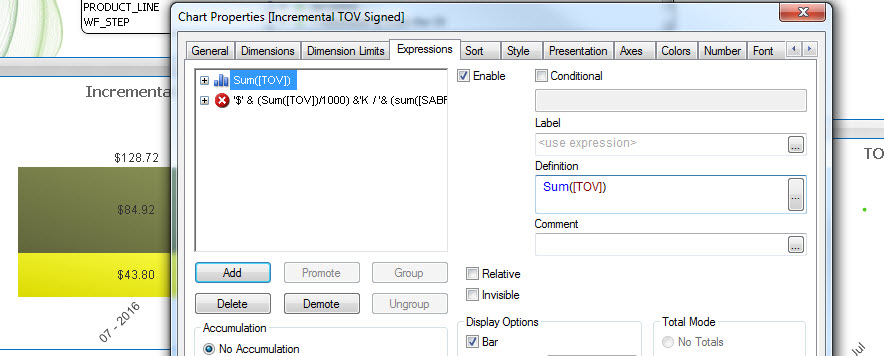
For example: when i just do simple sum([TOV]), it shows correctly i.e. 128.72 = 84.92 + 43.80
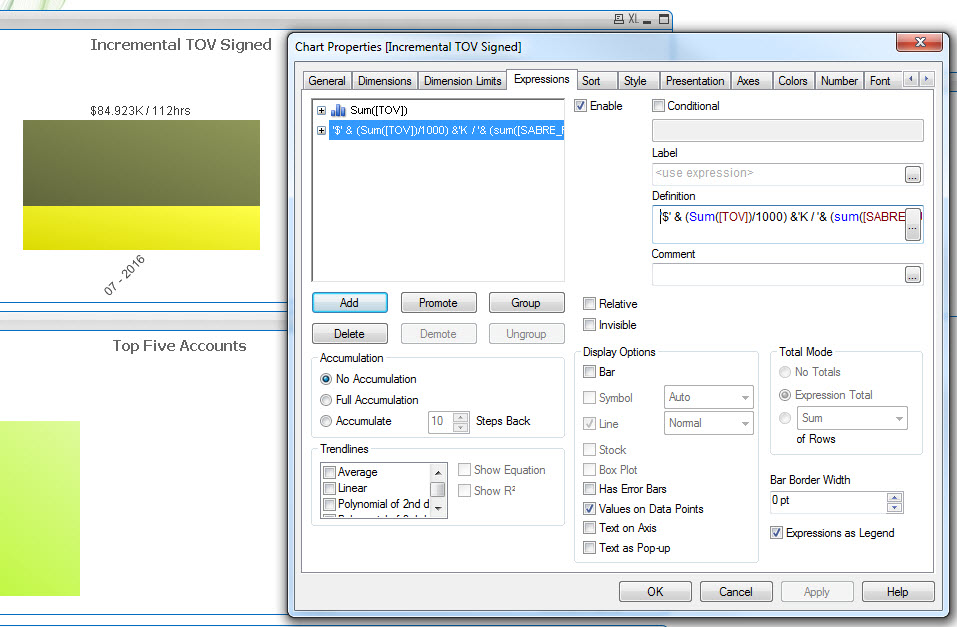
But when i do it with expression '$' & (Sum([TOV])/1000) &'K / '& (sum([FUNDED_HRS])) & 'hrs' like mentioned above in the thread, it shows value for only one segement i.e. 84.92 . deosn't include the value of yellow segment in this case. any idea ?
More details on my issue can be found on this question which has been marked as answered and I was advised to put a separate question for this issue!. https://community.qlik.com/message/1196368?et=watches.email.thread#1196368
Thank you in advance for your kind help.
Gaurav
- « Previous Replies
-
- 1
- 2
- Next Replies »
Accepted Solutions
- Mark as New
- Bookmark
- Subscribe
- Mute
- Subscribe to RSS Feed
- Permalink
- Report Inappropriate Content
You just want the total at the top? May be this
Num(Sum(TOTAL <MonthYear> [TOV]/1000), '$#,##0.00K / ') & (Num(Sum(TOTAL <MonthYear> [FUNDED_HRS]), '##. hrs'))
- Mark as New
- Bookmark
- Subscribe
- Mute
- Subscribe to RSS Feed
- Permalink
- Report Inappropriate Content
Try to disable the First expression and then see or you may share to solve with you dummy application
- Mark as New
- Bookmark
- Subscribe
- Mute
- Subscribe to RSS Feed
- Permalink
- Report Inappropriate Content
Hi Anil,
Disabling the First expression doesn't fix the issue. How can I share it? I cannot share QVW due to data.
Thanks,
Gaurav
- Mark as New
- Bookmark
- Subscribe
- Mute
- Subscribe to RSS Feed
- Permalink
- Report Inappropriate Content
NP, Don't share original data create dummy data and then share with us. We can give number of options unfortunately those are not make sense. If you send the application then it would better for one luck
- Mark as New
- Bookmark
- Subscribe
- Mute
- Subscribe to RSS Feed
- Permalink
- Report Inappropriate Content
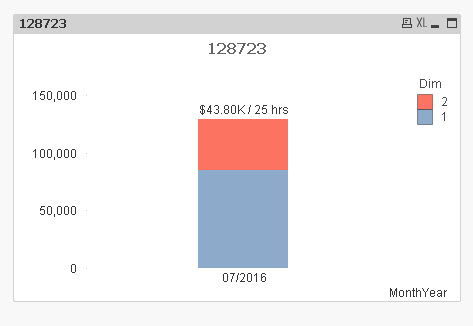
When I use this
Num(Sum([TOV]/1000), '$#,##0.00K / ') & (Num(Sum([FUNDED_HRS]), '##. hrs'))
I got this
- Mark as New
- Bookmark
- Subscribe
- Mute
- Subscribe to RSS Feed
- Permalink
- Report Inappropriate Content
Attaching application will not be possible since it will require a significant effort in scrambling. is they any other option you think can help? I can share scheenshots of chart properties.
Thanks,
Gaurav
- Mark as New
- Bookmark
- Subscribe
- Mute
- Subscribe to RSS Feed
- Permalink
- Report Inappropriate Content
Thanks, Sunny. I tried this expression i.e. converting it in Num but it doesn't work. Can you show this (sum of these two i.e. $128.72K / 137 hrs ) on top of bar and attach your file.
Try to uncheck "Plot Values Inside Segment" under Presentation property to show it on top of the bar. I am also wondering if there is any option in properties that I need to enable or disable to fix.
Thanks,
Gaurav
- Mark as New
- Bookmark
- Subscribe
- Mute
- Subscribe to RSS Feed
- Permalink
- Report Inappropriate Content
I tried doing it in your example... same issue exists. It shows value for only one cell ![]()

- Mark as New
- Bookmark
- Subscribe
- Mute
- Subscribe to RSS Feed
- Permalink
- Report Inappropriate Content
I attached an example file below. Please check it out.
- Mark as New
- Bookmark
- Subscribe
- Mute
- Subscribe to RSS Feed
- Permalink
- Report Inappropriate Content
You just want the total at the top? May be this
Num(Sum(TOTAL <MonthYear> [TOV]/1000), '$#,##0.00K / ') & (Num(Sum(TOTAL <MonthYear> [FUNDED_HRS]), '##. hrs'))
- « Previous Replies
-
- 1
- 2
- Next Replies »


