Unlock a world of possibilities! Login now and discover the exclusive benefits awaiting you.
- Qlik Community
- :
- All Forums
- :
- QlikView App Dev
- :
- Re: Chart showing thousand Symbol but expression n...
- Subscribe to RSS Feed
- Mark Topic as New
- Mark Topic as Read
- Float this Topic for Current User
- Bookmark
- Subscribe
- Mute
- Printer Friendly Page
- Mark as New
- Bookmark
- Subscribe
- Mute
- Subscribe to RSS Feed
- Permalink
- Report Inappropriate Content
Chart showing thousand Symbol but expression not getting values divided
Hi All,
I have a bar chart with dimension as Date and the expression as SUM(PASS).
In the Numbers tab i have given symbol of
Thousand as K
Million as M
and Billion as B
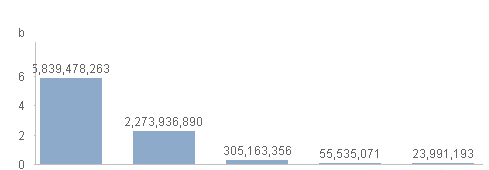
The chart shows K symbol and the value as 7300 which is actually seven thousand three hundred, so the chart should show 7.3 on the bar of the chart else it should not show the K symbol. either one will be correct.
Not sure if i am missing anything here.
Regards
- Tags:
- bar chart
- Mark as New
- Bookmark
- Subscribe
- Mute
- Subscribe to RSS Feed
- Permalink
- Report Inappropriate Content
Unfortunately is this not implemented in that way - it showed only these symbol to the number within the chart. If you want to show your numbers as k or m you need the following:
num(YourExpression / 1000, '#.##0 k') // thousands
num(YourExpression / 1000000, '#.##0,0 m') // millions
You could this make dynamic with variables like:
vDivider:
1000
vUnit:
= pick(match($(vDivider), 1000, 1000000), '#.##0 k', '#.##0,0 m')
and as expression:
num(YourExpression / $(vDivider), '$(vUnit)')
- Marcus
- Mark as New
- Bookmark
- Subscribe
- Mute
- Subscribe to RSS Feed
- Permalink
- Report Inappropriate Content
It used to work like that, they screwed it with version 9 or 10 (can't remember). It worked in 8.5.
I raised the issue several times, once I even got a promise that will be fixed.... never happened.
- Mark as New
- Bookmark
- Subscribe
- Mute
- Subscribe to RSS Feed
- Permalink
- Report Inappropriate Content
Looks to be working in V12, unless I'm missing something

Andy
- Mark as New
- Bookmark
- Subscribe
- Mute
- Subscribe to RSS Feed
- Permalink
- Report Inappropriate Content
Seems to work even in a recent 11.20 version (tested 11.20 SR11 X64).
Which version are you using? Could you post a screen shot?
Or are you talking about the value shown in the mouse over, which I think will just show the result in the format of the of the expression (not taking the symbols into account).
- Mark as New
- Bookmark
- Subscribe
- Mute
- Subscribe to RSS Feed
- Permalink
- Report Inappropriate Content

- Mark as New
- Bookmark
- Subscribe
- Mute
- Subscribe to RSS Feed
- Permalink
- Report Inappropriate Content
Hi Ashish,
Please make sure to do the division in the expression itself. I have faced a similar issue with showing Millions and had to divide by 1000000 in the expression which resolved the issue.
- Mark as New
- Bookmark
- Subscribe
- Mute
- Subscribe to RSS Feed
- Permalink
- Report Inappropriate Content
You are right - in SR13 it worked in normal charts but not in table-charts because these options are grayed out.
- Marcus
- Mark as New
- Bookmark
- Subscribe
- Mute
- Subscribe to RSS Feed
- Permalink
- Report Inappropriate Content
The scaling of the "Values on Datapoints" was restored about SR11, and it works in QV12 as well.
The popup value does not scale though.
See
Bar Chart Viz Tidbits in Version 12 | Qlikview Cookbook
-Rob