Unlock a world of possibilities! Login now and discover the exclusive benefits awaiting you.
- Qlik Community
- :
- All Forums
- :
- QlikView App Dev
- :
- Chart with Date Columns
- Subscribe to RSS Feed
- Mark Topic as New
- Mark Topic as Read
- Float this Topic for Current User
- Bookmark
- Subscribe
- Mute
- Printer Friendly Page
- Mark as New
- Bookmark
- Subscribe
- Mute
- Subscribe to RSS Feed
- Permalink
- Report Inappropriate Content
Chart with Date Columns
I'm trying to build a chart with our chart of accounts as the dimension, using the current months total $(Total) as the measurement, which gives me the total from the selected date. I then want to add 11 columns that will return the total amounts from the prior 11 months, so that I always have a running 12 month total for each account listed. 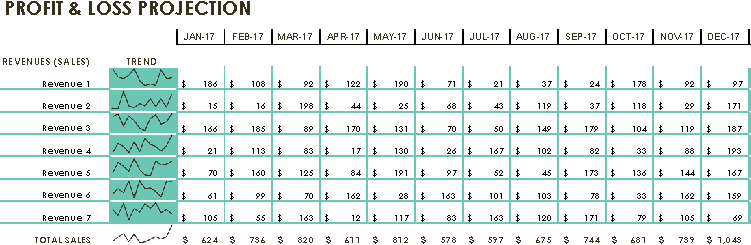
- Mark as New
- Bookmark
- Subscribe
- Mute
- Subscribe to RSS Feed
- Permalink
- Report Inappropriate Content
Hi Dave,
In some scenarios it can be precalculated on script but usually you need a solution like The As-Of Table
Here you have another document of the same subject with some table examples: Calculating rolling n-period totals, averages or other aggregations
- Mark as New
- Bookmark
- Subscribe
- Mute
- Subscribe to RSS Feed
- Permalink
- Report Inappropriate Content
create a YearMonth field in your data table to simplify the calculations
example: 201601,201602 and so on
and vStartYearMonth = Date(Addmonths( Date(Max(YearMonth),'YYYYMM'),-11),'YYYYMM')
You expression should then be
SUM ( {< YearMonth = {">=$(vStartYearMonth))"} >} Sales)
Just ensure your Month variables are '00' format meaning Jan is '01' and not '1'
Period Presets: Compare Periods on the fly
If a post helps to resolve your issue, please accept it as a Solution.