Unlock a world of possibilities! Login now and discover the exclusive benefits awaiting you.
- Qlik Community
- :
- All Forums
- :
- QlikView App Dev
- :
- Re: Chart with variation between days
- Subscribe to RSS Feed
- Mark Topic as New
- Mark Topic as Read
- Float this Topic for Current User
- Bookmark
- Subscribe
- Mute
- Printer Friendly Page
- Mark as New
- Bookmark
- Subscribe
- Mute
- Subscribe to RSS Feed
- Permalink
- Report Inappropriate Content
Chart with variation between days
Hi!
I have a chart with values per day and asset code. And I'd like to have the variation from one day to the other for each asset code.
how can I do it?
Accepted Solutions
- Mark as New
- Bookmark
- Subscribe
- Mute
- Subscribe to RSS Feed
- Permalink
- Report Inappropriate Content
Then try this:
Aggr(Sum({$<[ANO DO PREGAO] = {'2016'},[MES PREGAO]={'09'}>}(VALUE)/100)-Above(Sum({$<[ANO DO PREGAO] = {'2016'},[MES PREGAO]={'09'}>}(VALUE)/100)), ASSET_CODE, DAY)
- Mark as New
- Bookmark
- Subscribe
- Mute
- Subscribe to RSS Feed
- Permalink
- Report Inappropriate Content
Is this the goal?
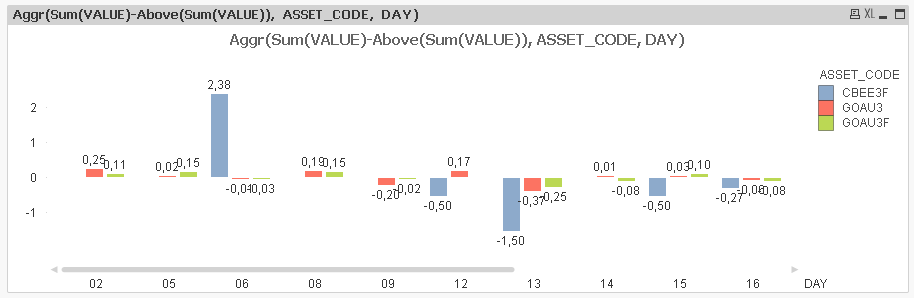
Expression:
Aggr(Sum(VALUE)-Above(Sum(VALUE)), ASSET_CODE, DAY)
- Mark as New
- Bookmark
- Subscribe
- Mute
- Subscribe to RSS Feed
- Permalink
- Report Inappropriate Content
My origninal expression has some setanalysis, how can do as you did above in this case?
(SUM({$<[ANO DO PREGAO] = {'2016'},[MES PREGAO]={'09'}>}(VALUE)/100))
- Mark as New
- Bookmark
- Subscribe
- Mute
- Subscribe to RSS Feed
- Permalink
- Report Inappropriate Content
Then try this:
Aggr(Sum({$<[ANO DO PREGAO] = {'2016'},[MES PREGAO]={'09'}>}(VALUE)/100)-Above(Sum({$<[ANO DO PREGAO] = {'2016'},[MES PREGAO]={'09'}>}(VALUE)/100)), ASSET_CODE, DAY)
- Mark as New
- Bookmark
- Subscribe
- Mute
- Subscribe to RSS Feed
- Permalink
- Report Inappropriate Content
worked!
thanks