Unlock a world of possibilities! Login now and discover the exclusive benefits awaiting you.
- Qlik Community
- :
- All Forums
- :
- QlikView App Dev
- :
- Chart
- Subscribe to RSS Feed
- Mark Topic as New
- Mark Topic as Read
- Float this Topic for Current User
- Bookmark
- Subscribe
- Mute
- Printer Friendly Page
- Mark as New
- Bookmark
- Subscribe
- Mute
- Subscribe to RSS Feed
- Permalink
- Report Inappropriate Content
Chart
Dimensions for this chart are quarters. Three different expressions. For example the one for the bars is this:
avg(if([Survey1]='Expectations ',if([Answer Flag] =1, Score)))
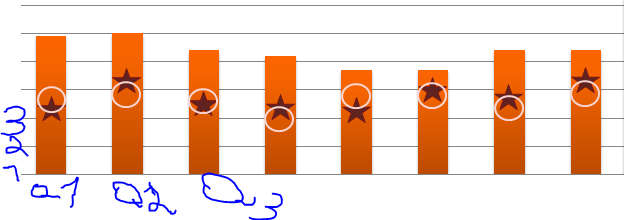
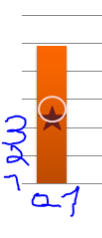
If I only want to see a graph with Q1 in it how should I modify my formular?
- Tags:
- new_to_qlikview
Accepted Solutions
- Mark as New
- Bookmark
- Subscribe
- Mute
- Subscribe to RSS Feed
- Permalink
- Report Inappropriate Content
Hi, for the 2nd way the expression should be:
avg({<[Survey1]={'Expectations '},[Answer Flag] ={'1'},Quarter={'Q1'}>} Score)
- Mark as New
- Bookmark
- Subscribe
- Mute
- Subscribe to RSS Feed
- Permalink
- Report Inappropriate Content
Hey,
Easy thing: Just create a list box for Quarter and select the Q1 and lock the selections.
2nd way:
If you want see the Q1 only in a static way you have to modify the set analysis as below in all expressions:
avg({<[Survey1]={'Expectations '},[Answer Flag] =1,Quarter={'Q1'}>} Score)
in you columns you should have Quarter column.
3rd way:
Also if you use below statement , users can select the quarters from any list box.
avg({<[Survey1]={'Expectations '},[Answer Flag] =1>} Score)
BR,
Chinna
- Mark as New
- Bookmark
- Subscribe
- Mute
- Subscribe to RSS Feed
- Permalink
- Report Inappropriate Content
Hi Chinna,
1st way
When I lock it all my other tabs get loccked and show value for Q1 only
2nd way
I tried to apply the formula and it does not work 
3rd way
This tab will need to show some other info as well, so selecting from list box Q1, would not work.
is there another way to do this?
- Mark as New
- Bookmark
- Subscribe
- Mute
- Subscribe to RSS Feed
- Permalink
- Report Inappropriate Content
Hi, for the 2nd way the expression should be:
avg({<[Survey1]={'Expectations '},[Answer Flag] ={'1'},Quarter={'Q1'}>} Score)
- Mark as New
- Bookmark
- Subscribe
- Mute
- Subscribe to RSS Feed
- Permalink
- Report Inappropriate Content
Thank you!