Unlock a world of possibilities! Login now and discover the exclusive benefits awaiting you.
- Qlik Community
- :
- All Forums
- :
- QlikView App Dev
- :
- Re: Charts: Showing cumlative budget vs spend-to-d...
- Subscribe to RSS Feed
- Mark Topic as New
- Mark Topic as Read
- Float this Topic for Current User
- Bookmark
- Subscribe
- Mute
- Printer Friendly Page
- Mark as New
- Bookmark
- Subscribe
- Mute
- Subscribe to RSS Feed
- Permalink
- Report Inappropriate Content
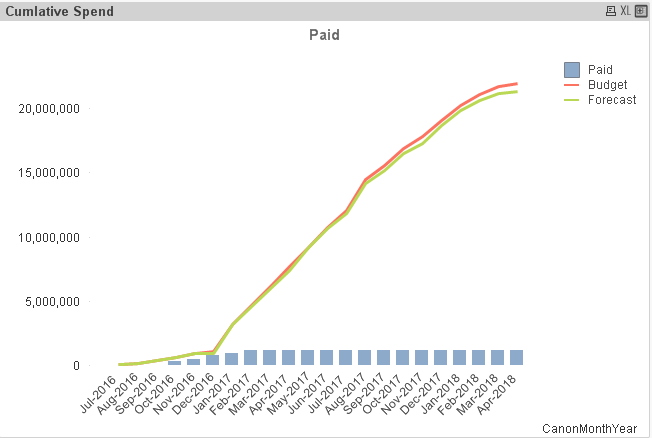
Charts: Showing cumlative budget vs spend-to-date
I have been able to get a chart that includes cumulative total for Budget, Forecast and Spend (Paid). However - I want the Spend (Paid) bars to END with the current month. I want the blue bars (in the chart below) to STOP at the current month. I will list below all the things I have tried that have NOT worked. For the chart shown a simple sum was used and Full Accumulation was checked:
These have NOT worked (each line used independently):
sum(TrxnAmount)
=aggr(sum(if(Date(CanonMonthYear,'MMM-YYYY')<=Today(),TrxnAmount,null())),CanonMonthYear)
=sum(IF((TrxnDate <= CanonDate), TrxnAmount))
=if(CanonMonthYear<=Today(),Sum (TrxnAmount),null())
Accepted Solutions
- Mark as New
- Bookmark
- Subscribe
- Mute
- Subscribe to RSS Feed
- Permalink
- Report Inappropriate Content
May be check no accumulation with this expression
=If(CanonMonthYear <= Today(), RangeSum(Above(Sum(TrxnAmount), 0, RowNo())))
- Mark as New
- Bookmark
- Subscribe
- Mute
- Subscribe to RSS Feed
- Permalink
- Report Inappropriate Content
May be check no accumulation with this expression
=If(CanonMonthYear <= Today(), RangeSum(Above(Sum(TrxnAmount), 0, RowNo())))
- Mark as New
- Bookmark
- Subscribe
- Mute
- Subscribe to RSS Feed
- Permalink
- Report Inappropriate Content
Thank you, Sunny - but that did not work.
- Mark as New
- Bookmark
- Subscribe
- Mute
- Subscribe to RSS Feed
- Permalink
- Report Inappropriate Content
YES YES.. that did work (I read it wrong first off)
Thank yoU!
- Mark as New
- Bookmark
- Subscribe
- Mute
- Subscribe to RSS Feed
- Permalink
- Report Inappropriate Content
Super 