Unlock a world of possibilities! Login now and discover the exclusive benefits awaiting you.
- Qlik Community
- :
- All Forums
- :
- QlikView App Dev
- :
- Re: Charts on different axes
- Subscribe to RSS Feed
- Mark Topic as New
- Mark Topic as Read
- Float this Topic for Current User
- Bookmark
- Subscribe
- Mute
- Printer Friendly Page
- Mark as New
- Bookmark
- Subscribe
- Mute
- Subscribe to RSS Feed
- Permalink
- Report Inappropriate Content
Charts on different axes
Hello everyone, I created a bar graph as shown in Figure 1 attached
chart includes three bars, the total size of the A and the B size.
I need to represent the dimensions A and B lines on different axes to represent the total as shown in Figure B.
someone would know tell me how you manage to do this the QlickView?
Thank you
Andrea
- Mark as New
- Bookmark
- Subscribe
- Mute
- Subscribe to RSS Feed
- Permalink
- Report Inappropriate Content
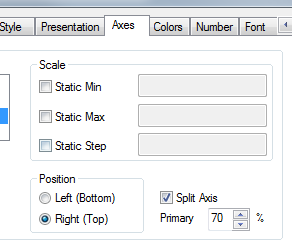
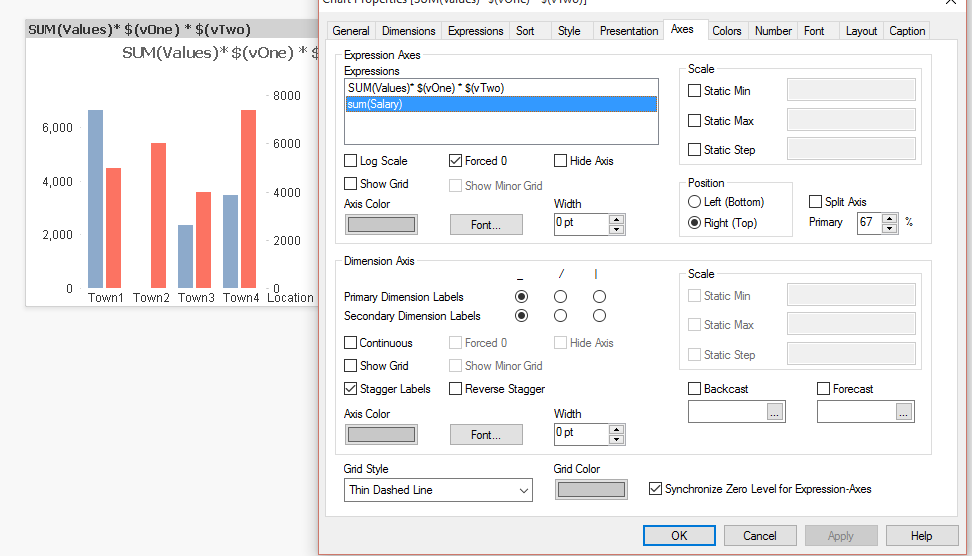
in tab Axes you can define that your expressions belong to left or right axes
both axes can be independant

- Mark as New
- Bookmark
- Subscribe
- Mute
- Subscribe to RSS Feed
- Permalink
- Report Inappropriate Content
Use a Combo Chart
- Mark as New
- Bookmark
- Subscribe
- Mute
- Subscribe to RSS Feed
- Permalink
- Report Inappropriate Content
Grazie per la cortese e veloce risposta
ho provato ma non riesco , in allegato invio il file AVD di esempio e l'immagine del risultato che vorrei ottenere
Grazie 1000
- Mark as New
- Bookmark
- Subscribe
- Mute
- Subscribe to RSS Feed
- Permalink
- Report Inappropriate Content
Thanks for your kind and quick response
I tried but I can not, in sending the attached file AVD sample and the image of the result that I would get
thanks !1000
- Mark as New
- Bookmark
- Subscribe
- Mute
- Subscribe to RSS Feed
- Permalink
- Report Inappropriate Content
Thanks for your kind and quick response
I tried but I can not, in sending the attached file AVD sample and the image of the result that I would get
thanks 1000
- Mark as New
- Bookmark
- Subscribe
- Mute
- Subscribe to RSS Feed
- Permalink
- Report Inappropriate Content
Hi
PFA,
Regards
Rajesh Kumar
- Mark as New
- Bookmark
- Subscribe
- Mute
- Subscribe to RSS Feed
- Permalink
- Report Inappropriate Content
You need to change the chart to a Combo Chart.