Unlock a world of possibilities! Login now and discover the exclusive benefits awaiting you.
- Qlik Community
- :
- All Forums
- :
- QlikView App Dev
- :
- Re: Cohort Analysis
- Subscribe to RSS Feed
- Mark Topic as New
- Mark Topic as Read
- Float this Topic for Current User
- Bookmark
- Subscribe
- Mute
- Printer Friendly Page
- Mark as New
- Bookmark
- Subscribe
- Mute
- Subscribe to RSS Feed
- Permalink
- Report Inappropriate Content
Cohort Analysis
Hi Guys,
I am trying to do a cohort analysis in Qlikview. I am getting the numbers but the placement of the data are wrong.
Dimension (201510) refers to the joined date of the new customers. 0 1 2 3 are based on YYYYMM (Current Year Month) to determine. However I would like 0 (expression) to take reference of the YYYYMM from Cohort first YYYYMM data. Meaning 0 in 201510 refers to 201510 and 1 refers to 201511 in YYYYMM. But in 201511 , 0 refers to 201511 and 1 refers to 201512.
Is this achievable through dimensionality.
| Cohort_First_YYYYMM | 0 | 1 | 2 | 3 |
| 201510 | 2 | 1 | 0 | 31 |
| 201511 | 1 | 7 | 97 | 0 |
| 201512 | 12 | 399 | 0 | 0 |
| 201601 | 133 | 0 | 0 | 0 |
Accepted Solutions
- Mark as New
- Bookmark
- Subscribe
- Mute
- Subscribe to RSS Feed
- Permalink
- Report Inappropriate Content
Unfortunately i cannot upload the solution (client security policy), but this is the load script:
Data:
LOAD *,
Dual('Mth: ' & (OrderSeq - FirstSeq), OrderSeq - FirstSeq) As Vintage
;
LOAD *,
Year(YYYYMM) * 12 + Month(YYYYMM) As OrderSeq,
Year(Cohort_First_YYYYMM) * 12 + Month(Cohort_First_YYYYMM) As FirstSeq
;
LOAD Cust_Status,
Date#(YYYYMM, 'yyyyMM') As YYYYMM,
Date#(Cohort_First_YYYYMM, 'yyyyMM') As Cohort_First_YYYYMM,
[Order date],
Customer_Unique_ID
FROM Cohort.xlsx
(ooxml, embedded labels, table is Sheet1);
Now create a pivot with the dimensions Cohort_First_YYYYMM and Vintage
with the expression Count(distinct Customer_Unique_ID).
Drag the vintage dimension to the top and click on "Suppress When Value is Null" on Chart Properties | Dimension
Set the Null and Missing symbols to 0 in Chart Properties | Presentation if you don't want - for the missing values:
- Mark as New
- Bookmark
- Subscribe
- Mute
- Subscribe to RSS Feed
- Permalink
- Report Inappropriate Content
Desired output
| Cohort_First_YYYYMM | 0 | 1 | 2 | 3 |
| 201510 | 31 | 0 | 1 | 2 |
| 201511 | 97 | 7 | 1 | - |
| 201512 | 399 | 12 | - | - |
| 201601 | 133 | - | - | - |
- Mark as New
- Bookmark
- Subscribe
- Mute
- Subscribe to RSS Feed
- Permalink
- Report Inappropriate Content
I suggest that you post a qvw document that inline loads some sample data (or loading from an uploaded file) with some representative data. I think i understand what you want (like vintage curves), but I dont have the capacity to create everything from scratch.
- Mark as New
- Bookmark
- Subscribe
- Mute
- Subscribe to RSS Feed
- Permalink
- Report Inappropriate Content
Attached.
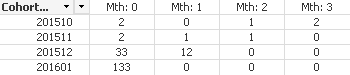
Desired output is
| Cohort_First_YYYYMM | Mth:0 | Mth:1 | Mth:2 | Mth:3 |
| 201510 | 2 | 0 | 1 | 2 |
| 201511 | 2 | 1 | 1 | 0 |
| 201512 | 33 | 12 | 0 | 0 |
| 201601 | 133 | 0 | 0 | 0 |
able to paste the expression over here if is able to solve.
thanks
- Mark as New
- Bookmark
- Subscribe
- Mute
- Subscribe to RSS Feed
- Permalink
- Report Inappropriate Content
Please upload the source spreadsheet as well to develop and test the load script.
- Mark as New
- Bookmark
- Subscribe
- Mute
- Subscribe to RSS Feed
- Permalink
- Report Inappropriate Content
Attached with the data and qw
- Mark as New
- Bookmark
- Subscribe
- Mute
- Subscribe to RSS Feed
- Permalink
- Report Inappropriate Content
Unfortunately i cannot upload the solution (client security policy), but this is the load script:
Data:
LOAD *,
Dual('Mth: ' & (OrderSeq - FirstSeq), OrderSeq - FirstSeq) As Vintage
;
LOAD *,
Year(YYYYMM) * 12 + Month(YYYYMM) As OrderSeq,
Year(Cohort_First_YYYYMM) * 12 + Month(Cohort_First_YYYYMM) As FirstSeq
;
LOAD Cust_Status,
Date#(YYYYMM, 'yyyyMM') As YYYYMM,
Date#(Cohort_First_YYYYMM, 'yyyyMM') As Cohort_First_YYYYMM,
[Order date],
Customer_Unique_ID
FROM Cohort.xlsx
(ooxml, embedded labels, table is Sheet1);
Now create a pivot with the dimensions Cohort_First_YYYYMM and Vintage
with the expression Count(distinct Customer_Unique_ID).
Drag the vintage dimension to the top and click on "Suppress When Value is Null" on Chart Properties | Dimension
Set the Null and Missing symbols to 0 in Chart Properties | Presentation if you don't want - for the missing values:
- Mark as New
- Bookmark
- Subscribe
- Mute
- Subscribe to RSS Feed
- Permalink
- Report Inappropriate Content
Thanks! genius