Unlock a world of possibilities! Login now and discover the exclusive benefits awaiting you.
- Qlik Community
- :
- All Forums
- :
- QlikView App Dev
- :
- Re: Coloring Rows
- Subscribe to RSS Feed
- Mark Topic as New
- Mark Topic as Read
- Float this Topic for Current User
- Bookmark
- Subscribe
- Mute
- Printer Friendly Page
- Mark as New
- Bookmark
- Subscribe
- Mute
- Subscribe to RSS Feed
- Permalink
- Report Inappropriate Content
Coloring Rows
Hello Everybody,
I have a table box as below
| Company | division | EmpName | Salary |
| Comp1 | div1 | X | 15000 |
| Comp2 | div2 | Y | 16000 |
| Comp3 | div3 | Z | 17000 |
| Comp4 | div4 | P | 18000 |
Now I want the rows should be colored alternatively.
For Ex Row1 = Blue, Row 2 = Green
Row 3 = Blue, Row 4 = Green
Please advise.
Thanks in Advance
Sonali Singh
- Tags:
- new_to_qlikview
- Mark as New
- Bookmark
- Subscribe
- Mute
- Subscribe to RSS Feed
- Permalink
- Report Inappropriate Content
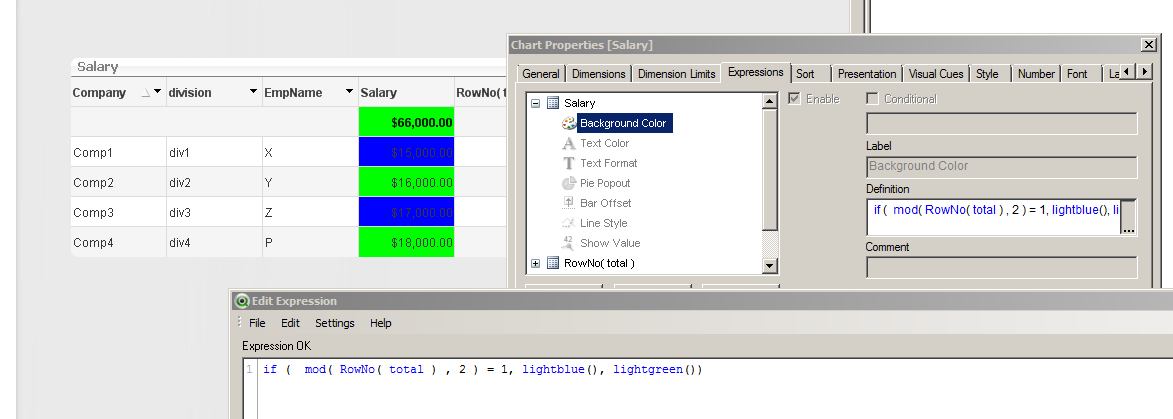
Try this as the cell background color.
if ( mod( RowNo( total ) , 2 ) = 1, lightblue(), lightgreen())
Use other color functions like rgb() to get better colors
- Mark as New
- Bookmark
- Subscribe
- Mute
- Subscribe to RSS Feed
- Permalink
- Report Inappropriate Content
Alternatively, you can go into User Settings >> Design Tab >> select Advanced under the default styling mode >> close out of that and right click on one of the cells >> select Custom Format Cell >> Play around there -- not sure if there is an 'every other row' function, but you can set background color.
It is generally held as best practice for colors to only be used to call attention to certain important data. The layout tab on chart properties should be sufficient to differentiate between adjacent rows in a table. Save color definitions to represent important data and positive/negative KPIs.
- Mark as New
- Bookmark
- Subscribe
- Mute
- Subscribe to RSS Feed
- Permalink
- Report Inappropriate Content
Hi Jonathan,
Thanks for reply. It is working but my requirement is something different.
| Submission ID | Trans ID | Amount |
| 2 | E | 300 |
| 3 | A | 500 |
| 3 | B | 1050 |
| 5 | C | 39 |
| 7 | C | 400 |
| 7 | D | 350 |
Now what I want is
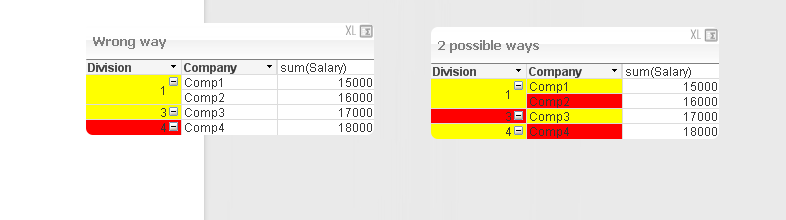
If Submission ID "2" is given blue then 3 should "yellow" then again 5 should be blue and 7 should be yellow.
But my ouput is coming something like this. Please find the attached file.
I am using a Pivot table for this.
Thanks In Advanse
Sonali
- Mark as New
- Bookmark
- Subscribe
- Mute
- Subscribe to RSS Feed
- Permalink
- Report Inappropriate Content
Sonali, I would use the Format Cell option described in my post with advanced default layout.
- Mark as New
- Bookmark
- Subscribe
- Mute
- Subscribe to RSS Feed
- Permalink
- Report Inappropriate Content
Hi,
Use Text Format in expanding your Expression .You can change the font color whatever you want to display for the particular row, by using like RGB(250,125,132).
Hope this helps
Regards
Krishna
- Mark as New
- Bookmark
- Subscribe
- Mute
- Subscribe to RSS Feed
- Permalink
- Report Inappropriate Content
In a pivot table the rowno() won't work. Instead you can use rank() to figure out the rows of the higher buckets
For the screenshot below the first expression has this background color
=if( mod(aggr( rank( total Division), Division), 2)=1,yellow(),lightred())
The 2nd (company) goes back to using the rowno()
=if( mod(RowNo(Total),2)=1,yellow(),lightred())