Unlock a world of possibilities! Login now and discover the exclusive benefits awaiting you.
- Qlik Community
- :
- All Forums
- :
- QlikView App Dev
- :
- Re: Coloring the Max and Min Values in Pivot Table...
- Subscribe to RSS Feed
- Mark Topic as New
- Mark Topic as Read
- Float this Topic for Current User
- Bookmark
- Subscribe
- Mute
- Printer Friendly Page
- Mark as New
- Bookmark
- Subscribe
- Mute
- Subscribe to RSS Feed
- Permalink
- Report Inappropriate Content
Coloring the Max and Min Values in Pivot Table Rows with Multiple Dimensions
Hello,
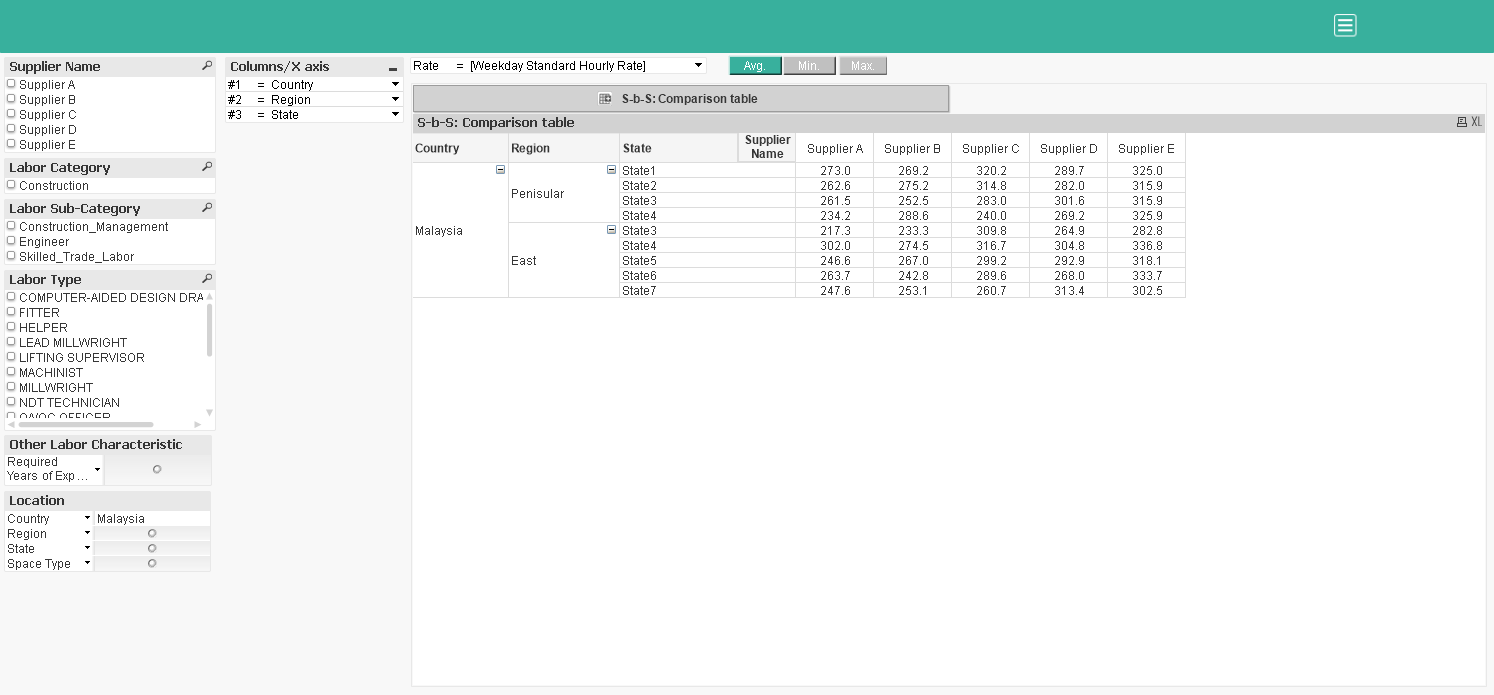
I have a table as shown in the image below

This table has the option of choosing multiple dimensions from a multi box named 'Columns/X-axis'. Now what I want is to color the minimum and maximum values in each row of the table. For example, say in the first row(Malaysia,Peninsular,State1) Supplier A has the least value(273) and Supplier E has max value(325). Say I'd like to color the least value(273) as green and max value(325) as red. I want to do this for all the rows in the table. Any help is much appreciated. I have tried the following expression in the Background option for the 'AVG' expression but it's not working:
if(Avg($(v_MP_Rate_Type))=Max(TOTAL <[Supplier Name]> $(v_MP_Rate_Type)),RGB(255,0,0))
I have attached the app for your reference. TIA! stalwar1
- « Previous Replies
- Next Replies »
- Mark as New
- Bookmark
- Subscribe
- Mute
- Subscribe to RSS Feed
- Permalink
- Report Inappropriate Content
Very clear. Thank you ![]()
- « Previous Replies
- Next Replies »