Unlock a world of possibilities! Login now and discover the exclusive benefits awaiting you.
- Qlik Community
- :
- All Forums
- :
- QlikView App Dev
- :
- Re: Re: Coloured Grid Chart modifying Luminosity p...
- Subscribe to RSS Feed
- Mark Topic as New
- Mark Topic as Read
- Float this Topic for Current User
- Bookmark
- Subscribe
- Mute
- Printer Friendly Page
- Mark as New
- Bookmark
- Subscribe
- Mute
- Subscribe to RSS Feed
- Permalink
- Report Inappropriate Content
Coloured Grid Chart modifying Luminosity parameter in HSL
Hello,
I want to build a Grid Chart showing which Product groups were sold, over a range of 3 years.
Please consider the example in the attachment. What I need is a chart like the following:
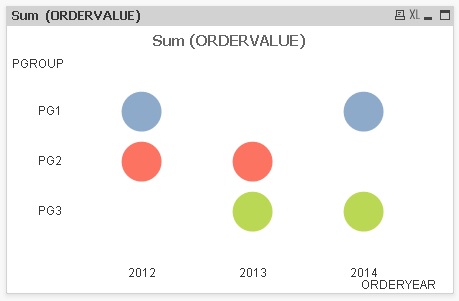
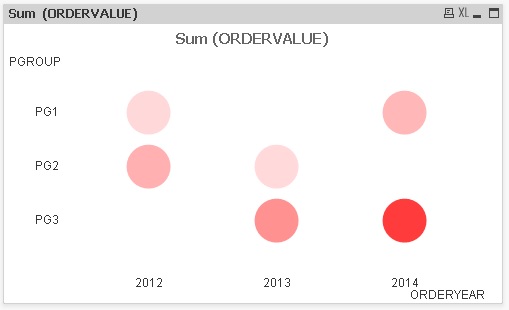
BUT the colors of circles will be set using the function HSL (hue, saturation, luminosity) keeping fixed hue and saturation parameters, and modifying the Luminosity parameter. this will result in a "light" circle for small values, "dark" circles for higher values.
As the luminosity should be set up using a linear function, I found the needed one:
y=(170*x+600-230*MAX)/(10-MAX) where x represent the Sum(OrderValue) and MAX the biggest element in the grid chart.
x is the sum(OrderValue), MAX is the maximum value between all sum(OrderValue) and y is the luminosity to be calculated,.
So, for Sum(ORDERVALUE)=10 we will have a luminosity=230, for the MAX we will have a luminosity=60 (darkest).
My problem is how to calculate the MAX parameter in this equation (because of my poor knowledge of aggregation functions!).
How to setup the calculus?
Many Thanks!
I understand in a grid chart using a "scale color" on the circles is the only way to give an idea about the circle values. In fact, a grid chart with variable-sized circles is not convenient when values differ too much. Little values generate invisible circles in this case; I do not know other ways to change size of circles in a grid chart i.e using a formula. Is that right? Thanks for any indications
Accepted Solutions
- Mark as New
- Bookmark
- Subscribe
- Mute
- Subscribe to RSS Feed
- Permalink
- Report Inappropriate Content
MAX would be defined as:
max(TOTAL aggr(Sum(ORDERVALUE),ORDERYEAR,PGROUP))
Thanks for including a sample qvw. Makes it much easier to answer your question.
-Rob
- Mark as New
- Bookmark
- Subscribe
- Mute
- Subscribe to RSS Feed
- Permalink
- Report Inappropriate Content
MAX would be defined as:
max(TOTAL aggr(Sum(ORDERVALUE),ORDERYEAR,PGROUP))
Thanks for including a sample qvw. Makes it much easier to answer your question.
-Rob
- Mark as New
- Bookmark
- Subscribe
- Mute
- Subscribe to RSS Feed
- Permalink
- Report Inappropriate Content
Thank you Rob for you precious help! I have to study better aggr()...! 
Here the qvd resulting, with two variations and a modification respect to my original thinking: I used rgb() instead of hsl()
- Mark as New
- Bookmark
- Subscribe
- Mute
- Subscribe to RSS Feed
- Permalink
- Report Inappropriate Content
Looks nice, Another approach I use is agrb() with a single color and just vary the "A" value.
-Rob