Unlock a world of possibilities! Login now and discover the exclusive benefits awaiting you.
- Qlik Community
- :
- All Forums
- :
- QlikView App Dev
- :
- Re: Combine 2 stacked bar charts having same dimen...
- Subscribe to RSS Feed
- Mark Topic as New
- Mark Topic as Read
- Float this Topic for Current User
- Bookmark
- Subscribe
- Mute
- Printer Friendly Page
- Mark as New
- Bookmark
- Subscribe
- Mute
- Subscribe to RSS Feed
- Permalink
- Report Inappropriate Content
Combine 2 stacked bar charts having same dimensions
Hello all,
i have 2 stacked charts exactly same looking, but the values are different since one is with respect to filter (WSTG) and the other one is excluding the filter (WSTG) - i have done this is expressions with set analysis.
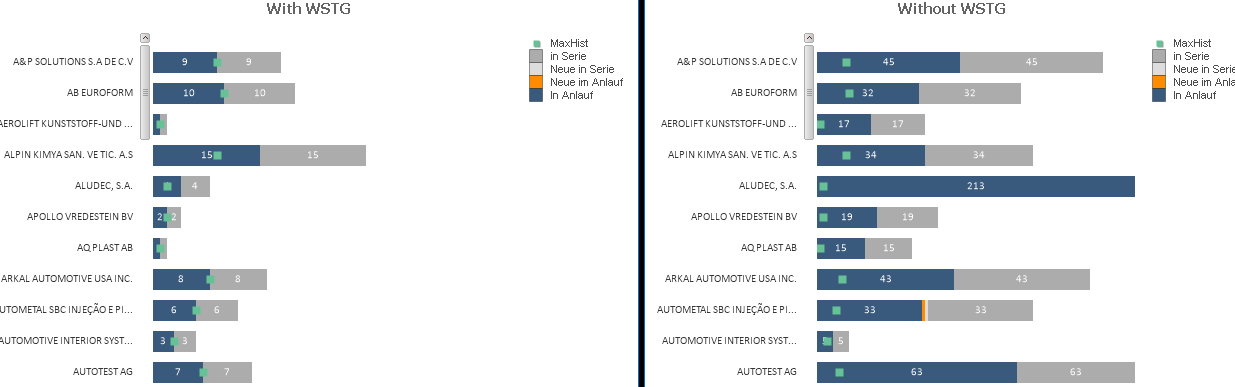
i have to combine both the dimensions and show it as single chart (with same scrollbar) , side by side . is this possible?
Thanks,
Supriya.
- « Previous Replies
-
- 1
- 2
- Next Replies »
- Mark as New
- Bookmark
- Subscribe
- Mute
- Subscribe to RSS Feed
- Permalink
- Report Inappropriate Content
May be it's bit tricky.
But, Combine both dimensions as Single in a list box and bar chart.
Comparisons like this are normally done by simply selecting the two values you want to compare in the SAME list box, not in two different list boxes, it's how it would normally be done, think so.
- Mark as New
- Bookmark
- Subscribe
- Mute
- Subscribe to RSS Feed
- Permalink
- Report Inappropriate Content
i just want to remove the extra dimension from middle and have common dimension for both chart.
i tried using butterfly option, but scroll is a problem
- Mark as New
- Bookmark
- Subscribe
- Mute
- Subscribe to RSS Feed
- Permalink
- Report Inappropriate Content
hello all,
anyone having any ideas on this one?
i just have to combine two charts. any workaround would also do.
Thanks,
Supriya.
- Mark as New
- Bookmark
- Subscribe
- Mute
- Subscribe to RSS Feed
- Permalink
- Report Inappropriate Content
Would you able to share application to check?
- Mark as New
- Bookmark
- Subscribe
- Mute
- Subscribe to RSS Feed
- Permalink
- Report Inappropriate Content
I'm not aware of any way to control the scrolling of two charts from one scroll bar.
Best workaround I can think of is to add another dimension so you have a two-bar grouped chart, each bar stacked, and then flip one of the bars into the negative (multiply by -1) so they go in opposite directions. They will be offset since they're grouped, but at least they'll be next to each other and hopefully it'll be clear which one you want.
If you use that approach, you will have to combine the two expressions into one and selectively display the result for the second dimension. Otherwise, I don't think you can make QV use the expressions for grouping and the dimension for stacking.
- Mark as New
- Bookmark
- Subscribe
- Mute
- Subscribe to RSS Feed
- Permalink
- Report Inappropriate Content
hi Shoham,
Thanks for the reply.
But i already tried the Butterfly (-1 and joining) but scrolling is a problem, and if i make -1 only it looks not so good with dimensions in left.(can i have gap in between both?) and some +ve values are coming at the left 
Thanks,
Supriya
- Mark as New
- Bookmark
- Subscribe
- Mute
- Subscribe to RSS Feed
- Permalink
- Report Inappropriate Content
unfortunately not possble. you can take any 2 stack charts (with same dimensons but different values on expression).
- Mark as New
- Bookmark
- Subscribe
- Mute
- Subscribe to RSS Feed
- Permalink
- Report Inappropriate Content
If you do and share that QVW, Will help better.
- Mark as New
- Bookmark
- Subscribe
- Mute
- Subscribe to RSS Feed
- Permalink
- Report Inappropriate Content
Hello marcowedel , could you please help in this one?
I saw the solution you gave for following thread -- something similar solution would be great help.
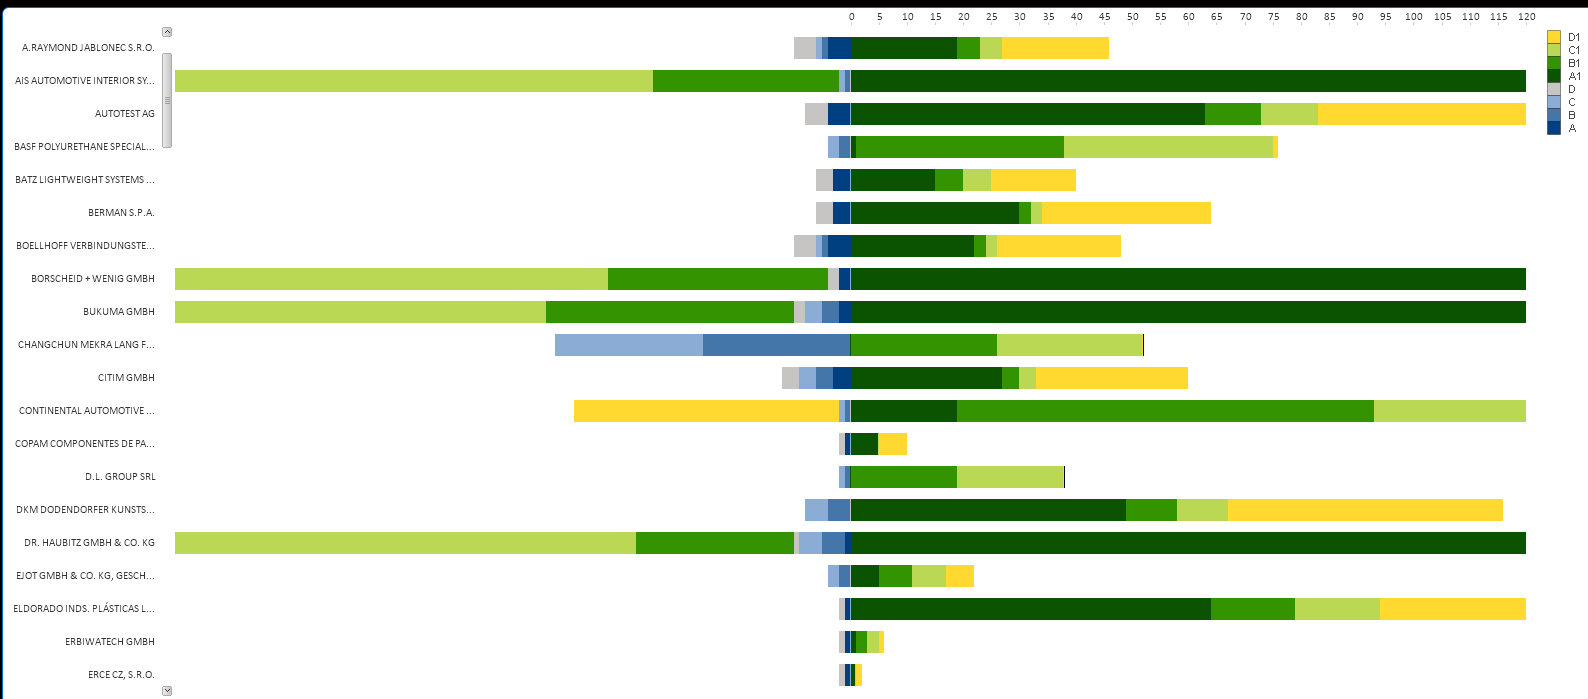
stacked and grouped barchart in qlikview
Problem is i have too many dimension values on X axis and have to use a scroll bar.
Thanks,
Supriya
- « Previous Replies
-
- 1
- 2
- Next Replies »