Unlock a world of possibilities! Login now and discover the exclusive benefits awaiting you.
- Qlik Community
- :
- All Forums
- :
- QlikView App Dev
- :
- Re: Combined Chart with 2 Expressions & Multicolor
- Subscribe to RSS Feed
- Mark Topic as New
- Mark Topic as Read
- Float this Topic for Current User
- Bookmark
- Subscribe
- Mute
- Printer Friendly Page
- Mark as New
- Bookmark
- Subscribe
- Mute
- Subscribe to RSS Feed
- Permalink
- Report Inappropriate Content
Combined Chart with 2 Expressions & Multicolor
Hello!
I have the following combined chart with 2 expressions (expression 1 are the bars and expression 2 are the dots):
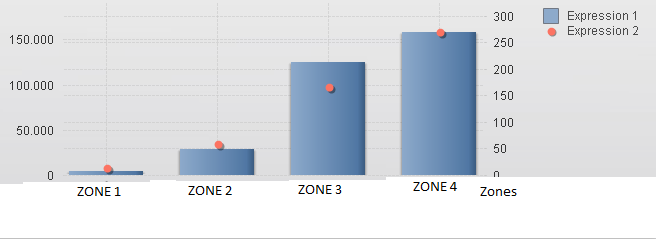
When I had only the first expression I had the option Multicolor activated and I could see a different color for every Zone.
Now I added the second expression and it just shows me the same blue color for all the Zones.
Is it possible to set a different color for every Zone?
Thank you!!!
- Tags:
- new_to_qlikview
- Mark as New
- Bookmark
- Subscribe
- Mute
- Subscribe to RSS Feed
- Permalink
- Report Inappropriate Content
I think the onlu way is to set the backgroud color of the bar depending on the Zone. Something like
If (Dimension = 'Zone 1', rgb(255, 0, 0),
if (Dimension = 'Zone 2', rgb(0, 255, 0), rgn(0,0,255)))
Another possibility is to create an inline load, associating each zone, with 3 fields (red, green, blue) which will later be used in the color of the background of that dimension.
Eduardo
- Mark as New
- Bookmark
- Subscribe
- Mute
- Subscribe to RSS Feed
- Permalink
- Report Inappropriate Content
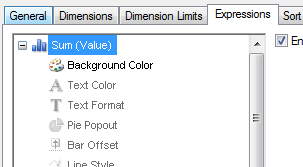
Check Background Color in Chart Expression Property. Use "If else condition" to fulfill your requirement.
Thanks