Unlock a world of possibilities! Login now and discover the exclusive benefits awaiting you.
- Qlik Community
- :
- All Forums
- :
- QlikView App Dev
- :
- Re: Combining Summary and Detailed Data within Piv...
- Subscribe to RSS Feed
- Mark Topic as New
- Mark Topic as Read
- Float this Topic for Current User
- Bookmark
- Subscribe
- Mute
- Printer Friendly Page
- Mark as New
- Bookmark
- Subscribe
- Mute
- Subscribe to RSS Feed
- Permalink
- Report Inappropriate Content
Combining Summary and Detailed Data within Pivot Table
Hello all,
I'm struggling with what I am finding to be a difficult challenge. There is a need to create a Pivot Table that, based on a role, will display certain detailed information AS WELL AS summarized information at parallel levels.
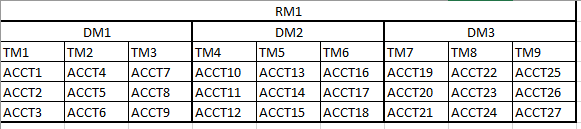
As a simple example, if this is my data in a hierarchy form:
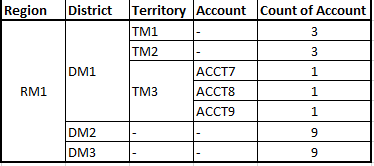
If the role of a user that looks at the generated Pivot Table is 'TM3', this is what needs to show - detailed data within TM3, summary data of parallel TM levels and summary data at the DM levels.:
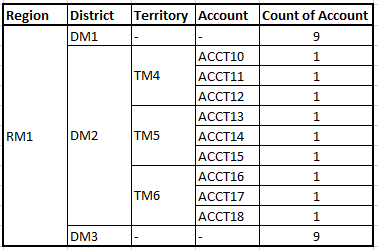
But if the role of the user that is looking at the Pivot Table is 'DM2', this is how the table should display - detailed data within the DM2 tree, but summary data at the parallel DM levels:
So, as you can see, depending on the role defined, there is a combination of detailed information in the downstream hierarchy of data, but summary information in parallel levels.
Because the role is going to be dynamically defined by the user logging into the application, the visualization needs to be dynamic enough to account for the different roles. I am open to show/hide conditions for different visuals depending on role type (RM, DM, TM) if that can manage things more easily.
I believe this can be accomplished using some complex Calculated Dimensions, but that causes the application to perform very poorly. I'd like to see if I can accomplish this within the expression(s) using Aggr() and potentially other functions such as match(), etc.
Hope I am expressing this concisely and appreciate any assistance or guidance.
- Mark as New
- Bookmark
- Subscribe
- Mute
- Subscribe to RSS Feed
- Permalink
- Report Inappropriate Content
It will be depending on if the detail-data are really confidential or if the main-goal is a certain kind of usability. If it's only usability you could use dimensions with a condition like:
if(Dimension = pick(match(osuser(), UserList), DimensionValuesList), Dimension, '-')
whereby UserList and DimensionValuesList are fields from an AccessTable (maybe implemented by variables which contain: concat(User, ',') - there are certainly more ways to implement such a logic).
If the data are confidential then you will need section access. Either with a really complex hierarchy - I have done such thing before (heavily nested loops with a lot of conditions to create the hierarchy-table) and couldn't really recommend it (we use now two specialiced applications) - or you need to load your data twice (one time with a normal section access logic and the second time with a consolidated level without the lower dimension-details).
Neither from them is near trivial and you will need some efforts to build a stable system. Here you could find a good starting point to the topic of Section Access.
- Marcus
- Mark as New
- Bookmark
- Subscribe
- Mute
- Subscribe to RSS Feed
- Permalink
- Report Inappropriate Content
Hi Marcus,
I attempted to create a very complex hierarchy and, as you've already experienced, it is not a recommended solution here as the consolidated logic becomes overly complex to build and maintain going forward.
The data is not confidential per se, so using an expression (or calculated dimension) is sufficient, considering other security measures being put into place. Section Access will be used to identify the user as well as some additional visibility rules.
I have tried something similar to your suggested IF() statement and, although it works to an extent, if used as a calculated dimension, the application performance suffers greatly on the visual rendering Do you see any way to incorporate a similar logic into the Expressions?
Will try your suggestion and see what I can find.
- Mark as New
- Bookmark
- Subscribe
- Mute
- Subscribe to RSS Feed
- Permalink
- Report Inappropriate Content
Do you use the dimension-approach like in my example or is it more complex with any aggr-functions? Of course such conditions needs some overhead but I wouldn't expect a significantly decrease of performance. Maybe there are other points which could be optimized.
- Marcus
- Mark as New
- Bookmark
- Subscribe
- Mute
- Subscribe to RSS Feed
- Permalink
- Report Inappropriate Content
I think I've managed to get this to work with the combination of Section Access to identify a role combined with the MATCH() function of the role on the dimensional levels. Additionally, set conditionals on the calculated dimension dependent on the Role of the users as the calculation needed to be handled differently per role.
It is also dependent on a Parent Role in the hierarchy to present detailed information or not. So the code looks at the Role of the user as well as their ParentRole to determine the Account data to show or summarize. Anything that is a summary of data is given a manually defined Dimension value of "xxx Rollup".
For TM Role at the Territory Dimension:
=if(match(UserRole,TM, DM, RM)>0 or match(ParentRole,DM, RM), TM,'Territory Rollup')
For DM or RM Role at the Territory Dimension:
=if(match(UserRole,DM, RM)>0, TM,'Territory Rollup')
Finally, at the Account level, have to also do a calculative check:
=if(match(UserRole,TM,DM,RM)>0,[ACCT],'Accounts Rollup')
This allows the visualizations to be highly dynamic, relative to the user role and performance on the Server is acceptable. This setup allows for expansion of this hierarchy setup to multiple metrics required.
Thank you for your help!