Unlock a world of possibilities! Login now and discover the exclusive benefits awaiting you.
- Qlik Community
- :
- All Forums
- :
- QlikView App Dev
- :
- Re: Combo Chart with grouped dimension..HELP..!!!!
- Subscribe to RSS Feed
- Mark Topic as New
- Mark Topic as Read
- Float this Topic for Current User
- Bookmark
- Subscribe
- Mute
- Printer Friendly Page
- Mark as New
- Bookmark
- Subscribe
- Mute
- Subscribe to RSS Feed
- Permalink
- Report Inappropriate Content
Combo Chart with grouped dimension..HELP..!!!!
Hi All,
I have following requirement from a client.
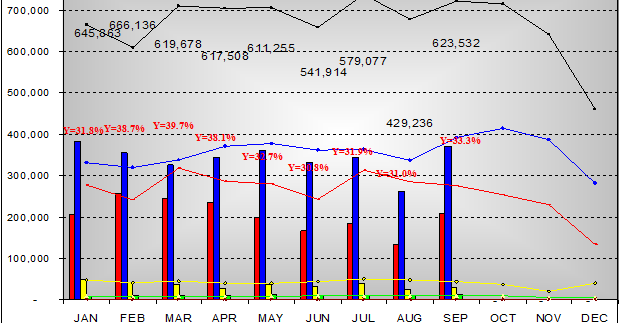
where bars are the sales of a particular brand monthly in current year, and lines are sales for last year for same brands.
the black line is sales for total brand in current year,...
how to do this in qlikview.....Plz help....
Thanks
Arun Goel
- Mark as New
- Bookmark
- Subscribe
- Mute
- Subscribe to RSS Feed
- Permalink
- Report Inappropriate Content
Arun,
Use a combo chart and set analysis and you should be fine I think.
For the lines you use Sum(Sales) and add a set analysis selection of a particular year (or dynamically by using Year(Today())-1 for example to get 2011 etc.).
- Mark as New
- Bookmark
- Subscribe
- Mute
- Subscribe to RSS Feed
- Permalink
- Report Inappropriate Content
Hi
In combo chart - Expression tab
for every expression we display in bars and lines
write ur expr and choose ur required in display options
bar,line,symbol