Unlock a world of possibilities! Login now and discover the exclusive benefits awaiting you.
- Qlik Community
- :
- All Forums
- :
- QlikView App Dev
- :
- Common header
- Subscribe to RSS Feed
- Mark Topic as New
- Mark Topic as Read
- Float this Topic for Current User
- Bookmark
- Subscribe
- Mute
- Printer Friendly Page
- Mark as New
- Bookmark
- Subscribe
- Mute
- Subscribe to RSS Feed
- Permalink
- Report Inappropriate Content
Common header
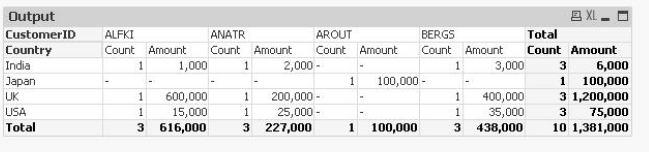
Is there any way to show a common header "CustomerID" above customer id values (ALKFI,ANTAR,AROUT,BERGS).
Currently it is displayed on left Side.
- Mark as New
- Bookmark
- Subscribe
- Mute
- Subscribe to RSS Feed
- Permalink
- Report Inappropriate Content
What you could do is to create a Dummy Dimension which groups all the values (ALFKI, ANATR...) and add it in the chart (hide dimension labels) and apply color format. But it is a kind of hack.
With standard Qlikview pivot table it is not possible to achieve it.
- Mark as New
- Bookmark
- Subscribe
- Mute
- Subscribe to RSS Feed
- Permalink
- Report Inappropriate Content
Hi,
try below methods
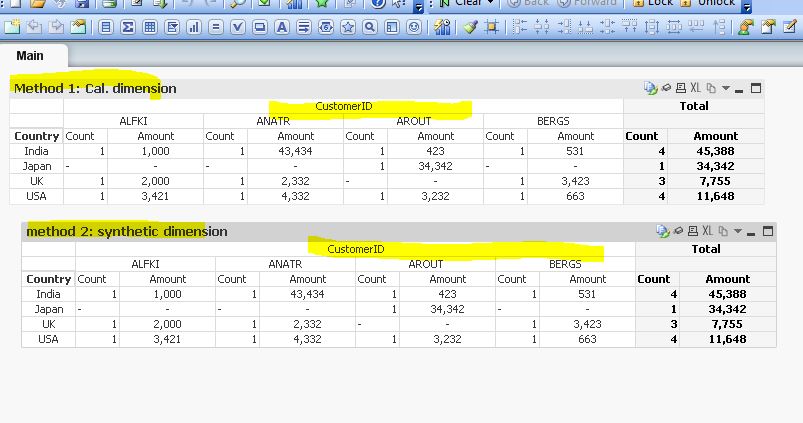
Method 1:
using Calculated dimension
=if(match(CustomerID,'ALFKI','ANATR','AROUT','BERGS'),'CustomerID')
Method 2: using synthetic dimension option
=valuelist('CustomerID')
Method 3: if you using more than one chart object better to go with data island back end script option/master dimension (sense)
Thanks,
Deva
- Mark as New
- Bookmark
- Subscribe
- Mute
- Subscribe to RSS Feed
- Permalink
- Report Inappropriate Content
Not Sure it may usefull or not, but create custom text box and hover over on chart next to Output
- Mark as New
- Bookmark
- Subscribe
- Mute
- Subscribe to RSS Feed
- Permalink
- Report Inappropriate Content
Qlik is not Excel!
It's a look and feel if you are using straight tables and pivot tables.
A better way to compare values is Charts. Use the power of visual charts.