Unlock a world of possibilities! Login now and discover the exclusive benefits awaiting you.
- Qlik Community
- :
- All Forums
- :
- QlikView App Dev
- :
- Re: Compare Sales for Current Period vs Previous P...
- Subscribe to RSS Feed
- Mark Topic as New
- Mark Topic as Read
- Float this Topic for Current User
- Bookmark
- Subscribe
- Mute
- Printer Friendly Page
- Mark as New
- Bookmark
- Subscribe
- Mute
- Subscribe to RSS Feed
- Permalink
- Report Inappropriate Content
Compare Sales for Current Period vs Previous Period
This is what I am trying to do. I have a report below is a picture.
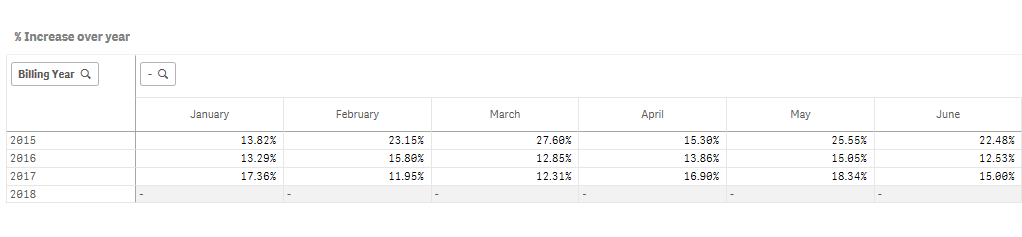
Percentages suppose to show by month increase of Sales.
Underlying data contains 3 years worse of data.
I was try to get data from sql. I am not sure how to do it in qlik. Would you share a script with me?
Thanks,
Inessa.
- « Previous Replies
-
- 1
- 2
- Next Replies »
- Mark as New
- Bookmark
- Subscribe
- Mute
- Subscribe to RSS Feed
- Permalink
- Report Inappropriate Content
Hi Sunny - here are more details:
The expression that you have suggested works in some cases , but not always.
(Aggr(Above(sum(AmountBilled), 12)-1, (BillingPeriodID, (NUMERIC))))
This is how chart looks like below - there are empty cell on a pivot , that should have data in:

Am I missing anything?
Thank you!!
- Mark as New
- Bookmark
- Subscribe
- Mute
- Subscribe to RSS Feed
- Permalink
- Report Inappropriate Content
Are you making selections?
- Mark as New
- Bookmark
- Subscribe
- Mute
- Subscribe to RSS Feed
- Permalink
- Report Inappropriate Content
Hi Sunny - there are filters exists on a report for a Billing Year to be selected if needed.
Report defaults to the past 3 years (starting from 01/01/2015).
- Mark as New
- Bookmark
- Subscribe
- Mute
- Subscribe to RSS Feed
- Permalink
- Report Inappropriate Content
Below are two tables to compare on the same report:
First have sum(AmountBilled) Bi Month/Year where measure expression simply: =Sum(AmountBilled):
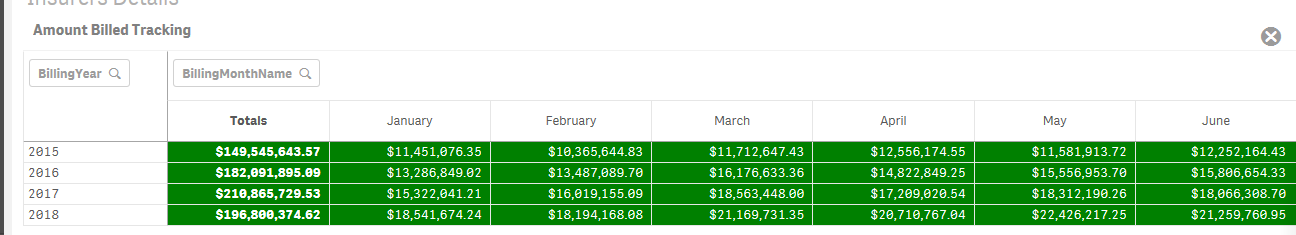
You see that all cells are populated.
Second report (below) should display sum(AmountBilled) for the same month, but previous year. It does display correct data in some cases: Jan - April 2016 for example display data for Jan- Apr 2015 (as you see sum(AmountBilled) is the same):
But - for May thru July 2016 there is no data that should have been display for the same months and 2015 as it show on a previous table.
Expression that I am using on a second table is:
=(Aggr(Above(sum(AmountBilled), 12)-1, (BillingPeriodID, (NUMERIC))))
Does it make sense? Thank you!!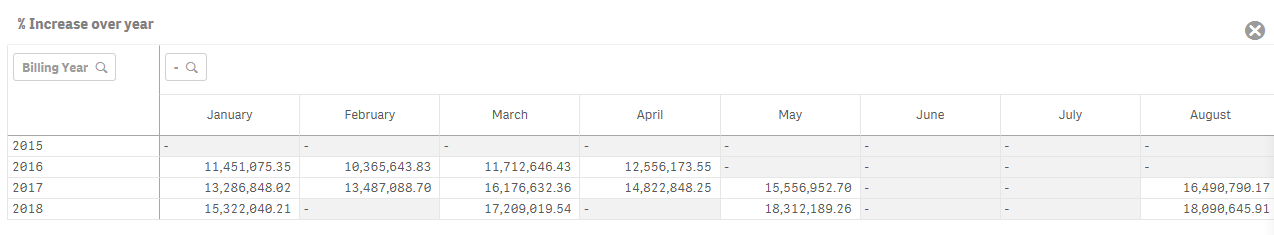
- Mark as New
- Bookmark
- Subscribe
- Mute
- Subscribe to RSS Feed
- Permalink
- Report Inappropriate Content
How about you try this
Above(Sum(AmountBilled))
- Mark as New
- Bookmark
- Subscribe
- Mute
- Subscribe to RSS Feed
- Permalink
- Report Inappropriate Content
Is it considered cheating to script this? Good results with minimal expression chart syntax, if scripting is allowed an additional column with Peek() statement. (**Limitation: You wouldn't be able to split pre-calculated aggregates with end-user UI selections)
- Mark as New
- Bookmark
- Subscribe
- Mute
- Subscribe to RSS Feed
- Permalink
- Report Inappropriate Content
Thanks Sunny ! I fixed that!! It is all good!
- Mark as New
- Bookmark
- Subscribe
- Mute
- Subscribe to RSS Feed
- Permalink
- Report Inappropriate Content
Thanks Evan for looking into it!!
- Mark as New
- Bookmark
- Subscribe
- Mute
- Subscribe to RSS Feed
- Permalink
- Report Inappropriate Content
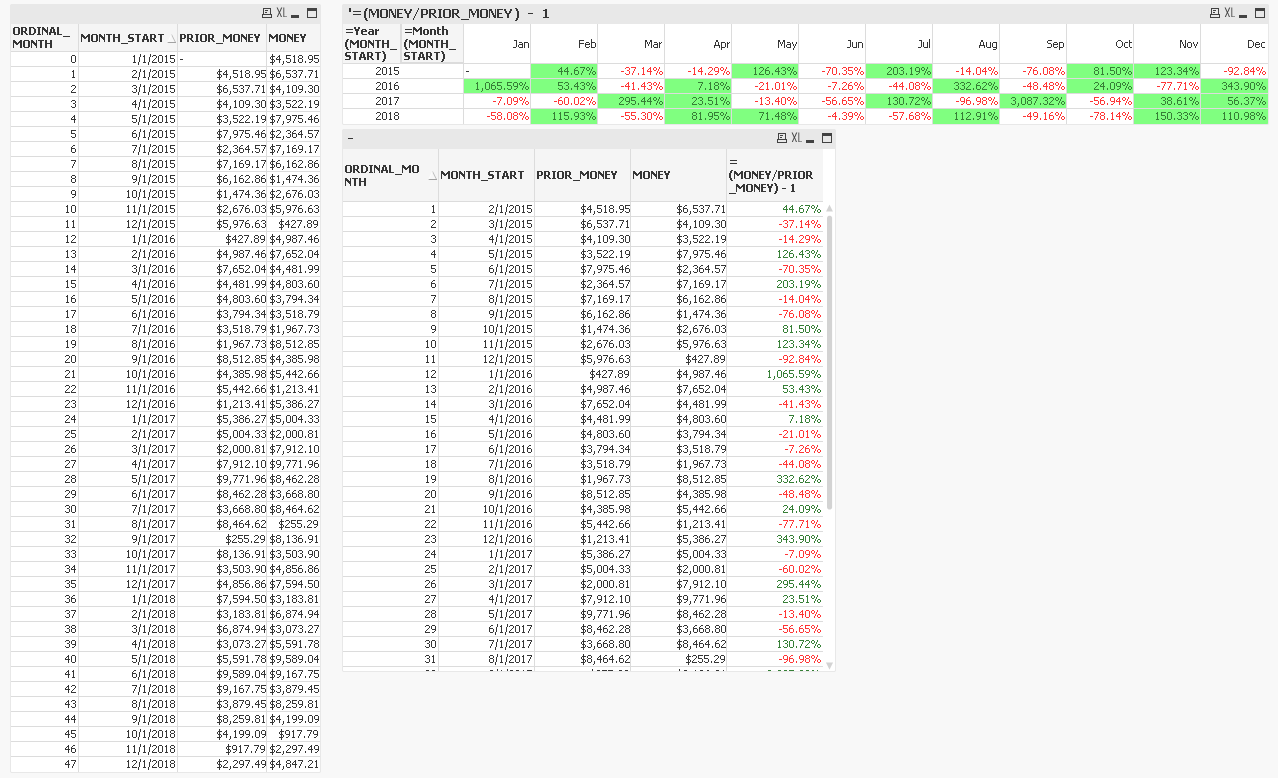
Sorry, forgot to include the script that generated those visualizations. Naturally this data sample would need adapted to your own data modeling.
FOR vMonth = 0 to 47
//CONCATENATE(MONTHS)
[MONTHS]:
LOAD
$(vMonth) AS ORDINAL_MONTH,
AddMonths(MakeDate(2015,1,1),$(vMonth)) AS MONTH_START,
Num(round(Rand() * 10000,.01),'$#,###.00') AS MONEY,
Peek(MONEY) AS PRIOR_MONEY
AUTOGENERATE(1);
NEXT
- Mark as New
- Bookmark
- Subscribe
- Mute
- Subscribe to RSS Feed
- Permalink
- Report Inappropriate Content
Thank you!!
- « Previous Replies
-
- 1
- 2
- Next Replies »