Unlock a world of possibilities! Login now and discover the exclusive benefits awaiting you.
- Qlik Community
- :
- All Forums
- :
- QlikView App Dev
- :
- Comparison Bar Chart: Sales person vs Entire group
- Subscribe to RSS Feed
- Mark Topic as New
- Mark Topic as Read
- Float this Topic for Current User
- Bookmark
- Subscribe
- Mute
- Printer Friendly Page
- Mark as New
- Bookmark
- Subscribe
- Mute
- Subscribe to RSS Feed
- Permalink
- Report Inappropriate Content
Comparison Bar Chart: Sales person vs Entire group
Hello All,
I am trying to create a comparison bar chart. I want to compare distribution of 'Distinct count [deal num]' by discount ranges across sales person Vs. Total Group distribution.
So I am using
two dimensions : 1) Disc Range 2)Sales person name
two expressions : 1) (DISTINCT [Deal Num]) 2) (DISTINCT ALL <[Disc Range]> [Deal Num]) - this is messing up my bar chart , I am getting duplicated bars for every sales person
Also, I tried using Show Total option in Dimension limits - the problem with this is the Total is getting changed based on the filter selection; in my case, I want to keep Total of the entire group static.
It will be really helpful if you could resolve this issue.
Thanks,
Varun
- Tags:
- chart
- new_to_qlikview
Accepted Solutions
- Mark as New
- Bookmark
- Subscribe
- Mute
- Subscribe to RSS Feed
- Permalink
- Report Inappropriate Content
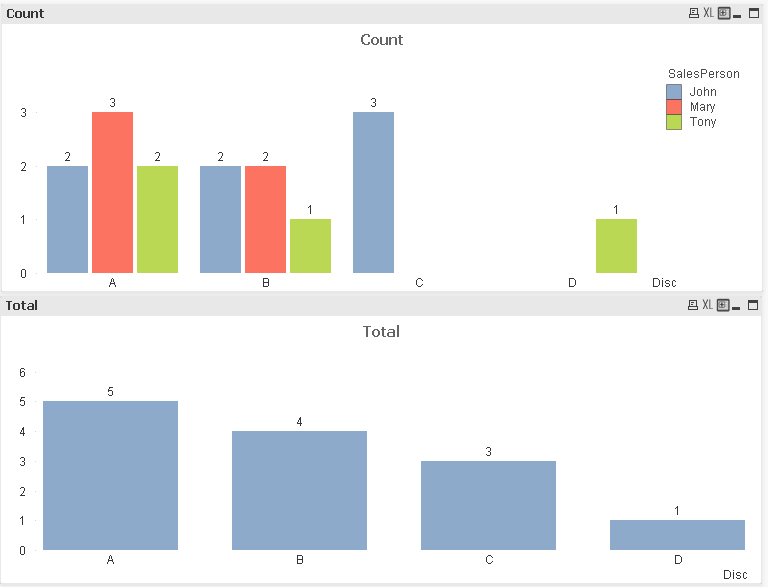
I would recommend maybe creating a separate chart for totals which would be never change no matter what the selections are. Like below. Because with two dimensions i dont think the two expressions would work the way you want it.
- Mark as New
- Bookmark
- Subscribe
- Mute
- Subscribe to RSS Feed
- Permalink
- Report Inappropriate Content
Try count(distinct [Deal Num]) and count({1} distinct total <Disc Range> [Deal Num])
talk is cheap, supply exceeds demand
- Mark as New
- Bookmark
- Subscribe
- Mute
- Subscribe to RSS Feed
- Permalink
- Report Inappropriate Content
Thanks a lot for giving it a try.. but I am facing the same issue. The second expression is getting repeated for every sales person again and again..
- Mark as New
- Bookmark
- Subscribe
- Mute
- Subscribe to RSS Feed
- Permalink
- Report Inappropriate Content
Hey Varun,
Is it possible to attach a sample file.
Thanks
AJ
- Mark as New
- Bookmark
- Subscribe
- Mute
- Subscribe to RSS Feed
- Permalink
- Report Inappropriate Content
Hi AJ,
I have converted my chart into Table so that it would be easy for you to understand. Check out the attachment below.
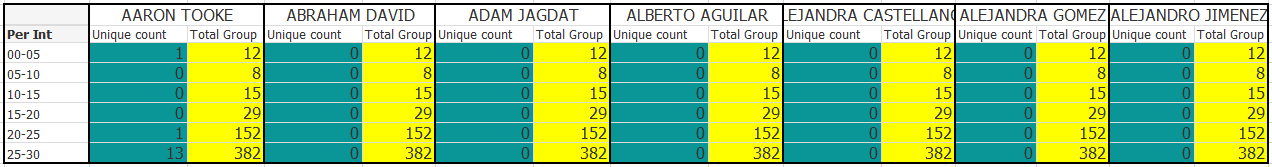
yellow columns is showing the same information across due to following expression:-
count({1} distinct total <Per Int> [Deal Num])
currently I have just made one selection for 'Aaron Tooke' still other sales persons are appearing. Hence it is messing up my bar chart. Ideal it should show 2 columns for Aaron one for Aaron's unique count and other one for Total Group.
In case if I select 2 sales person at a time it should show 3 columns one for unique count of 1st sales person 2nd for unique count for another sales person and last one should show total group.
Hope you understood what I am trying to achieve..
Thanks for your help.
I am using a desktop version of qlikview hence I cannot open the qvw file..
Kind Regards,
Varun
Kind Regards,
Varun
- Mark as New
- Bookmark
- Subscribe
- Mute
- Subscribe to RSS Feed
- Permalink
- Report Inappropriate Content
I would recommend maybe creating a separate chart for totals which would be never change no matter what the selections are. Like below. Because with two dimensions i dont think the two expressions would work the way you want it.
- Mark as New
- Bookmark
- Subscribe
- Mute
- Subscribe to RSS Feed
- Permalink
- Report Inappropriate Content
Thanks Ajay,
I thought we could solve this through set analysis. But like you suggested I would go for two charts. In case you come across any idea please do share that.
Thanks Again!
regards,
Varun