Unlock a world of possibilities! Login now and discover the exclusive benefits awaiting you.
- Qlik Community
- :
- All Forums
- :
- QlikView App Dev
- :
- Re: Comparison using loop functions
- Subscribe to RSS Feed
- Mark Topic as New
- Mark Topic as Read
- Float this Topic for Current User
- Bookmark
- Subscribe
- Mute
- Printer Friendly Page
- Mark as New
- Bookmark
- Subscribe
- Mute
- Subscribe to RSS Feed
- Permalink
- Report Inappropriate Content
Comparison using loop functions
Guys,
I have the two below requirements,
Assume I have 8 Customers and each customer can have some number of fields and if a customer is selected, it has to show the field count matching exactly with other customers with same map as shown below.
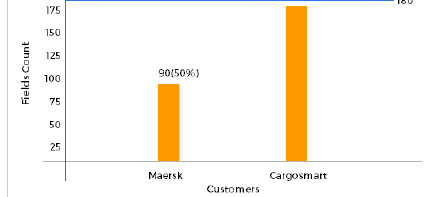
Here, "Hapag" customer is selected and it has "A" mapping. Out of 8 customers, 1 customer is selected. Now it needs to select the other 7 customers excluding the selected customer.
Then it needs to compare for the same "A" mapping. Out of 7 customers, only 2 customers are matched with same mapping as shown in the screenshot.
I've got this chart by writing expressions in the front end, but when the data increases performance will be poor. So, I need to pre-calculate these matching fields and store it as a dimension in script itself.
This is my first requirement and based on the above chart, I need to create another chart as shown below,
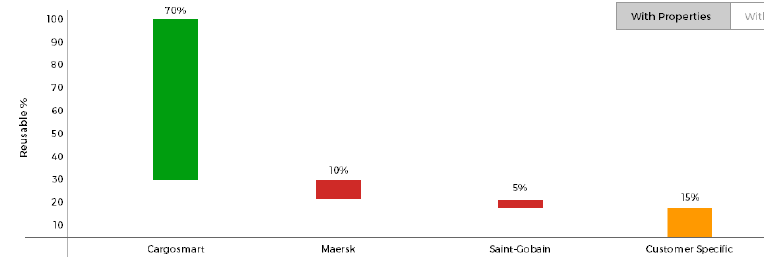
In this chart, I need to perform calculation in the script as below,
1. As per the above chart (Screenshot 1), Customer "Cargosmart" has the highest(70%) count and so it should be shown first in Chart (Screenshot 2).
2. So out of 100%, 70% achieved by Cargosmart. This 70% should be excluded for further calculation. So, out of remaining 30%, 10% achieved by Maersk as shown in Screeshot 2.
3. Similarly, it has to continue till it reaches total count i.e. 100%.
I need to do this in script itself by the help of any of the looping functions or you guys please suggest me how to proceeed with this in the script and to store the measures in dimensions rather doing by QV expressions.
I've been trying this for 2 months but it's very complicated. So please help me guys.
Thanks,
Siva
- Mark as New
- Bookmark
- Subscribe
- Mute
- Subscribe to RSS Feed
- Permalink
- Report Inappropriate Content
Couple of things
1) If you are having trouble with something for 2 months, it sure will take us some effort to figure this out. But what would help is if you share a sample with your initial post and explain what the issue is and what are you expecting to see. This was there is a better change for you to get helped faster
2) If you want to get someone's attention, you don't add them to the Tags at the bottom, but add them here like this vinieme12, marcus_sommer. Tags are used for searches, where as in text reference sends an email to the users you have tagged (depending on the settings).

- Mark as New
- Bookmark
- Subscribe
- Mute
- Subscribe to RSS Feed
- Permalink
- Report Inappropriate Content
I've also got solution from Antonio as shown in the below discussion,
But please suggest whether I can go by this way or not since I'm getting more no. of duplicates in this method.
- Mark as New
- Bookmark
- Subscribe
- Mute
- Subscribe to RSS Feed
- Permalink
- Report Inappropriate Content
Thanks Sunny. I would not use tags at bottom as you suggested.
I've attached my sample data with transform layer and presentation layer. In reusability tab of the presentation layer, I have my above two requirements (Charts from original discussion). Please help.
Thanks,
Siva.