Unlock a world of possibilities! Login now and discover the exclusive benefits awaiting you.
- Qlik Community
- :
- All Forums
- :
- QlikView App Dev
- :
- Comparsion of sales in stack bar chart
- Subscribe to RSS Feed
- Mark Topic as New
- Mark Topic as Read
- Float this Topic for Current User
- Bookmark
- Subscribe
- Mute
- Printer Friendly Page
- Mark as New
- Bookmark
- Subscribe
- Mute
- Subscribe to RSS Feed
- Permalink
- Report Inappropriate Content
Comparsion of sales in stack bar chart
Hi All,
Is it possible to compare sales of 2016 quarters with 2017 quarters in stack bar chart? But 2017 quarters must be always YTD sales.
Today : 27/07/2017
Ex: Q1 2016 - Jan, Feb, Mar of 2016. But Q12017 should be entire sales of 2017 upto today.
same applies for Q2 2016 - Apr, May, Jun of 2016 but Q2 2017 should be entire sales of 2017 upto today. same applies for Q3 and Q4 as well
Is it possible to achieve this? Thanks to advice
Regards,
Krishna
- Tags:
- rahul pawar
- Mark as New
- Bookmark
- Subscribe
- Mute
- Subscribe to RSS Feed
- Permalink
- Report Inappropriate Content
In fact, You could use something like below? But for me this is not make sense because what if you have more than 2 years data?
RELAXSEE:
if(CalendarYear='2016', mid(CalendarYearQtr,6,2) &' '& mid(CalendarYearQtr,3,2),mid(CalendarYearQtr,6,2) &' '& mid(CalendarYearQtr,3,2) &' YTD' = (mid(CalendarYearQtr,6,2) &' '& mid(CalendarYearQtr,3,2)), sum(if(ProductFamilyGroup = 'ELIFE' and ProductFamilyDescr='RELAXSEE',DeliveredQty,0)), sum({<Year, Month, DateField = {">=$(=YearStart(Max(DateField))) <=$(=Max(DateField))"}>} if(ProductFamilyGroup = 'ELIFE' and ProductFamilyDescr='RELAXSEE',DeliveredQty,0)))
ONLINE WIDE:
if(CalendarYear='2016', mid(CalendarYearQtr,6,2) &' '& mid(CalendarYearQtr,3,2),mid(CalendarYearQtr,6,2) &' '& mid(CalendarYearQtr,3,2) &' YTD' = (mid(CalendarYearQtr,6,2) &' '& mid(CalendarYearQtr,3,2)), sum(if(ProductFamilyGroup = 'ELIFE' and ProductFamilyDescr='RELAXSEE',DeliveredQty,0)), sum({<Year, Month, DateField = {">=$(=YearStart(Max(DateField))) <=$(=Max(DateField))"}>} if(ProductFamilyGroup = 'ELIFE' and ProductFamilyDescr='ONLINE WIDE',DeliveredQty,0)))
DIGILIFE:
if(CalendarYear='2016', mid(CalendarYearQtr,6,2) &' '& mid(CalendarYearQtr,3,2),mid(CalendarYearQtr,6,2) &' '& mid(CalendarYearQtr,3,2) &' YTD' = (mid(CalendarYearQtr,6,2) &' '& mid(CalendarYearQtr,3,2)), sum(if(ProductFamilyGroup = 'ELIFE' and ProductFamilyDescr='RELAXSEE',DeliveredQty,0)), sum({<Year, Month, DateField = {">=$(=YearStart(Max(DateField))) <=$(=Max(DateField))"}>} if(ProductFamilyGroup = 'ELIFE' and ProductFamilyDescr='DIGILIFE',DeliveredQty,0)))
HOME & OFFICE:
if(CalendarYear='2016', mid(CalendarYearQtr,6,2) &' '& mid(CalendarYearQtr,3,2),mid(CalendarYearQtr,6,2) &' '& mid(CalendarYearQtr,3,2) &' YTD' = (mid(CalendarYearQtr,6,2) &' '& mid(CalendarYearQtr,3,2)), sum(if(ProductFamilyGroup = 'ELIFE' and ProductFamilyDescr='RELAXSEE',DeliveredQty,0)), sum({<Year, Month, DateField = {">=$(=YearStart(Max(DateField))) <=$(=Max(DateField))"}>} if(ProductFamilyGroup = 'ELIFE' and ProductFamilyDescr='HOME & OFFICE',DeliveredQty,0)))
- Mark as New
- Bookmark
- Subscribe
- Mute
- Subscribe to RSS Feed
- Permalink
- Report Inappropriate Content
Anil, Always, I load last two years data in the dashboard. But when i update these expression, below attached error i am facing. I am unable to understand this syntax. Please advice.
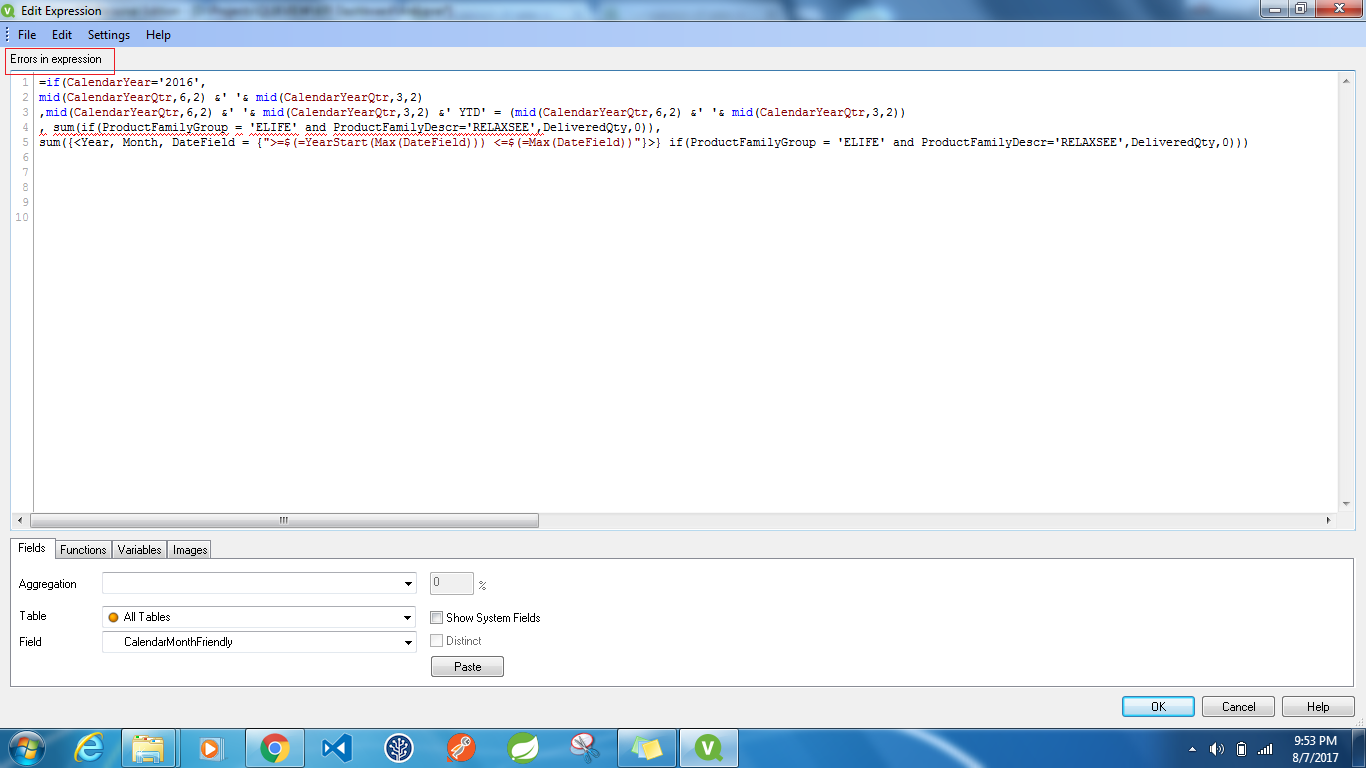
- Mark as New
- Bookmark
- Subscribe
- Mute
- Subscribe to RSS Feed
- Permalink
- Report Inappropriate Content
stalwar1 Bhai, Kuch ee dekho 
- Mark as New
- Bookmark
- Subscribe
- Mute
- Subscribe to RSS Feed
- Permalink
- Report Inappropriate Content
Jarur Anil bhai....
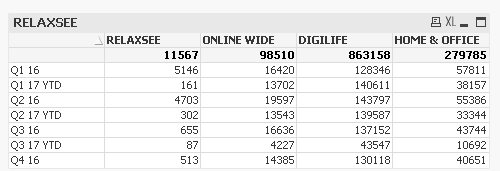
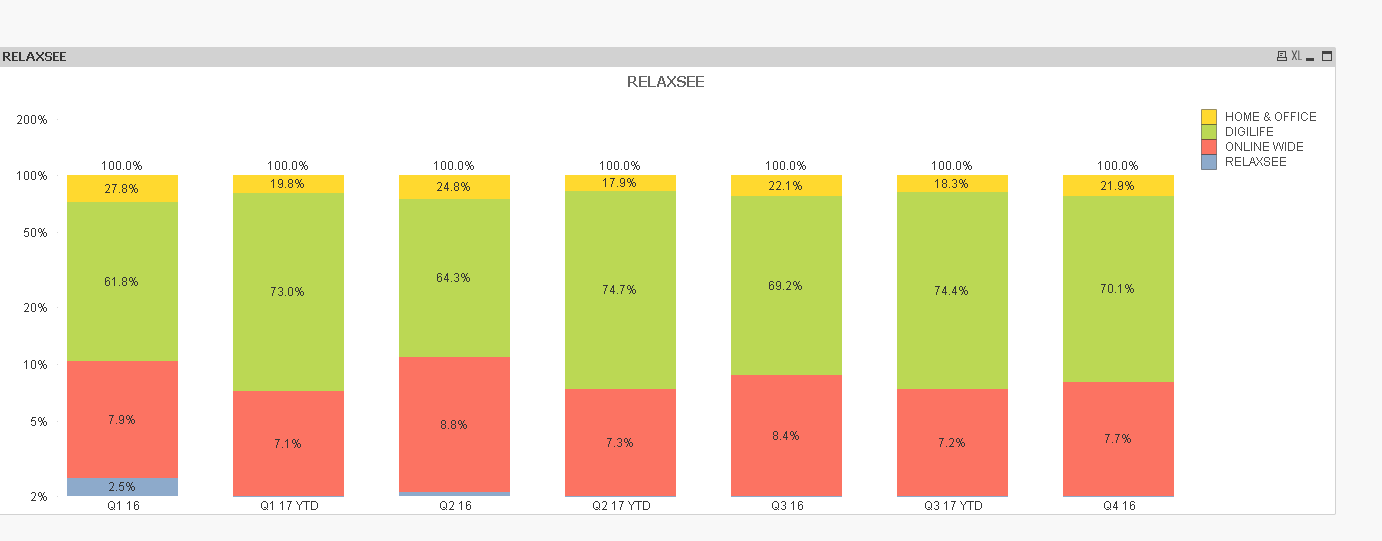
Are these numbers correct (without relative checked)? Just need each bar to sum up to 100%?
- Mark as New
- Bookmark
- Subscribe
- Mute
- Subscribe to RSS Feed
- Permalink
- Report Inappropriate Content
Is this the goal?
- Mark as New
- Bookmark
- Subscribe
- Mute
- Subscribe to RSS Feed
- Permalink
- Report Inappropriate Content
Hello Sunny,
Can you we write the expression like below for your attached qvw file?
=Sum({<ProductFamilyGroup = {'ELIFE'}, ProductFamilyDescr = {'HOME & OFFICE'}>} DeliveredQty)/
RangeSum(
Sum({<ProductFamilyGroup = {'ELIFE'}, ProductFamilyDescr = {'RELAXSEE','ONLINE WIDE','DIGILIFE','HOME & OFFICE'} >} DeliveredQty))
Just a thought.
- Mark as New
- Bookmark
- Subscribe
- Mute
- Subscribe to RSS Feed
- Permalink
- Report Inappropriate Content
Sure we can
Or this if these are the only 4 values
=Sum({<ProductFamilyGroup = {'ELIFE'}, ProductFamilyDescr = {'HOME & OFFICE'}>} DeliveredQty)/Sum({<ProductFamilyGroup = {'ELIFE'}, ProductFamilyDescr>} DeliveredQty)
- Mark as New
- Bookmark
- Subscribe
- Mute
- Subscribe to RSS Feed
- Permalink
- Report Inappropriate Content
Hi Sunny,
Goal, Is to compare Quarter wise data of 2016 with quarter wise 2017 YTD.
Ex: Q12016 - stack bar has to show data of Jan, Feb and Mar of 2016 quantity, But Q12017(Jan,Feb,Mar of 2017) should contain YTD data.
i.e, Q1 2017(Jan,Feb,Mar of 2017) , Q2 2017(Jan,Feb,Mar,Apr,Jun,July of 2017) , Q3 2017(9months of 2017),Q4 2017(12 months of 2017).
Thanks to confirm and advice about data model change as well.
Regards,
Krishna
- Mark as New
- Bookmark
- Subscribe
- Mute
- Subscribe to RSS Feed
- Permalink
- Report Inappropriate Content
I think still you are looking some other output. I am not sure, we are not following you.
Instead of that create straight table
Dimension as Month
And expressions are
1) Simple quarters of sales using 2016 for restriction
2) Create expression and do same with 2017 for YTD calculation.
POS - looks like this is for comparison so you could use bar graph to good presentation.
Note - I would ask high priority mark response as helpful that may link up your issue to look
- Mark as New
- Bookmark
- Subscribe
- Mute
- Subscribe to RSS Feed
- Permalink
- Report Inappropriate Content
Hi Anil, As i am new to qlikview, Please suggest me about below things possibly with a sample attachment. 1. Instead of that create straight table Dimension as Month And expressions are 1) Simple quarters of sales using 2016 for restriction 2) Create expression and do same with 2017 for YTD calculation.